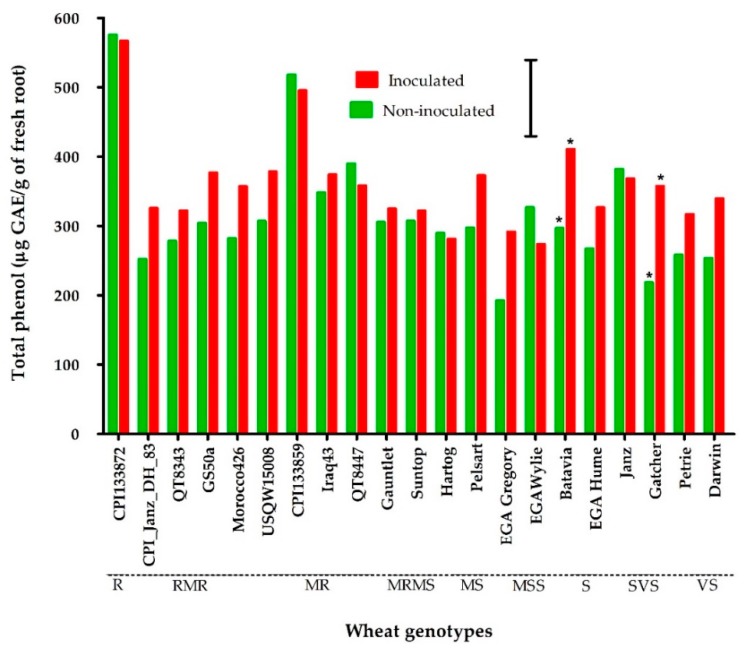
Figure 3.
Total phenols (µg gallic acid equivalent (GAE)/g of fresh root) at 8 weeks in the roots of Pratylenchus thornei inoculated (red) and non-inoculated (green) wheat genotypes ranging in resistance and susceptibility to Pratylenchus thornei. The values are the means of three replications. * represent a statistically significant difference (p < 0.05) between inoculated and non-inoculated treatments of a genotype. The bar marker indicates LSD = 110 (p = 0.05) for the interaction genotype* P. thornei. The resistance rating of each wheat genotype is shown along the X-axis.

