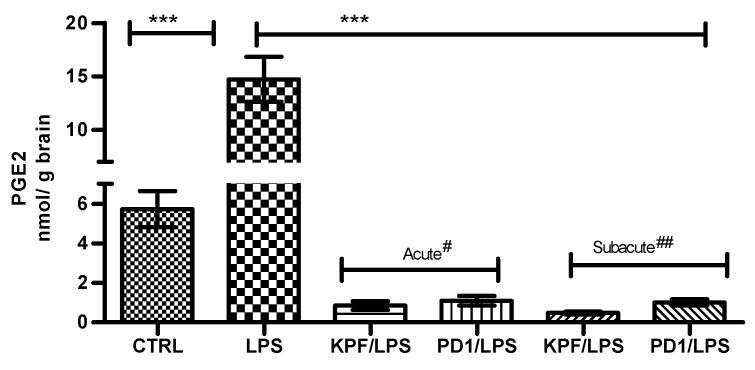
Figure 4.
PGE2 amounts in brain tissue samples in control-treated mice, 4 × 250 µg/kg LPS treated mice, 4 × 250 µg/kg LPS treated mice with acute# treatment of 25 µmol/kg PD1 or KPF, and 4 × 250 µg/kg LPS treated mice with subacute## treatment of 25 µmol/kg PD1or KPF. Data presented as mean ± SD, n = 6. Asterisks denote a statistically significant difference from the respective control. *** Denotes significance of p < 0.0001, one-way ANOVA, followed by Dunnett’s test. # Acute treatment refers to drug injection on the third and fourth days of LPS treatment. ## Subacute treatment refers to daily drug injection (4 days) simultaneously with the LPS treatment.

