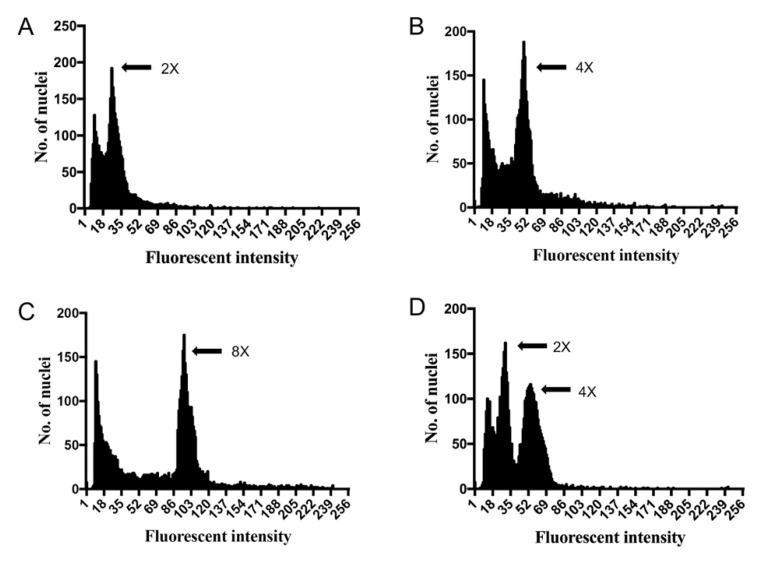
Figure 2.
Analysis of ploidy level for induced plants by flow cytometry. (A) Diploid plantlets as control peak value = 25.26 ± 1.08; (B) Induced tetraploids, peak value = 48.92 ± 1.81; (C) Induced octoploids, peak value = 94.94 ± 2.44; (D),Induced chimera plantlets, peak value = 25.25 ± 1.33 and 52.51 ± 2.01, respectively.

