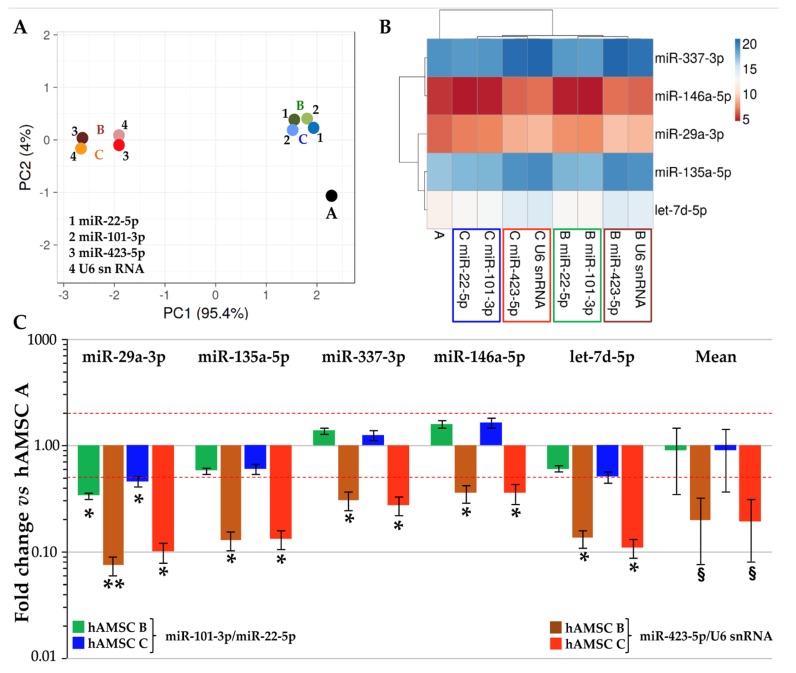
Figure 3.
Influence of RG selection on tendon-related hAMSC-EVs miRNA profile. (A) through (B) Principal components analysis and dendrogram of the CRT values of tendon-related miRNAs after stable miR-101-3p/22-5p or unreliable miR-423-5p/U6 snRNA RG normalization. (A)–(C) indicate the three donors. For the dendrogram, each row represents a miRNA and each column represents a sample. The sample clustering tree is shown at the top. The color scale shown in the map illustrates the relative expression levels of miRNAs across all samples: red shades represent high expression levels (low CRT) and blue shades represent lower expression levels (high CRT). (C) Effects of RG normalization on the abundance of tendon-related miRNAs differentially expressed between hAMSC-EVs samples. hAMSC A-EVs set as 1; § p-value < 0.1, * p-value < 0.05 and ** p-value < 0.01.

