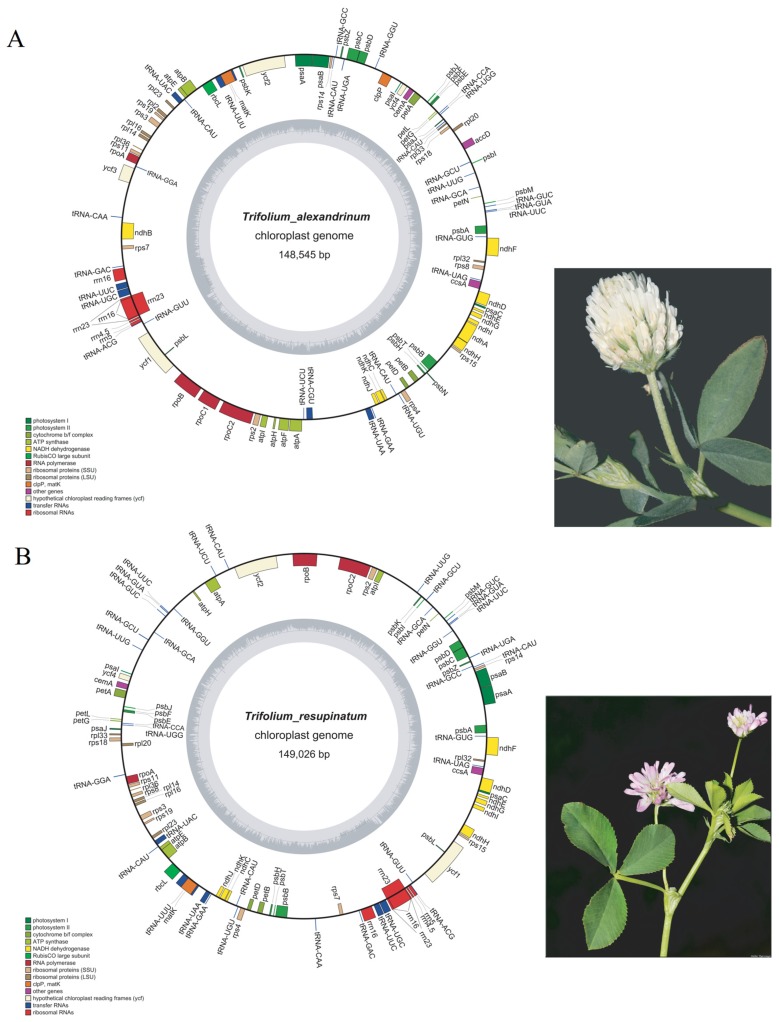
Figure 1.
Gene maps of T. alexandrinum (A), T. resupinatum (B) cp genomes and pictures of T. alexandrinum and T. resupinatum were shown right in the gene maps. Pictures were cited from the open website http://plants-of-styria.uni-graz.at. Genes drawn inside and outside of the circle are transcribed clockwise and counterclockwise, respectively. Genes belonging to different functional groups are color coded. The darker gray color and lighter gray color in the inner circle corresponds to the GC content and the AT content, respectively.

