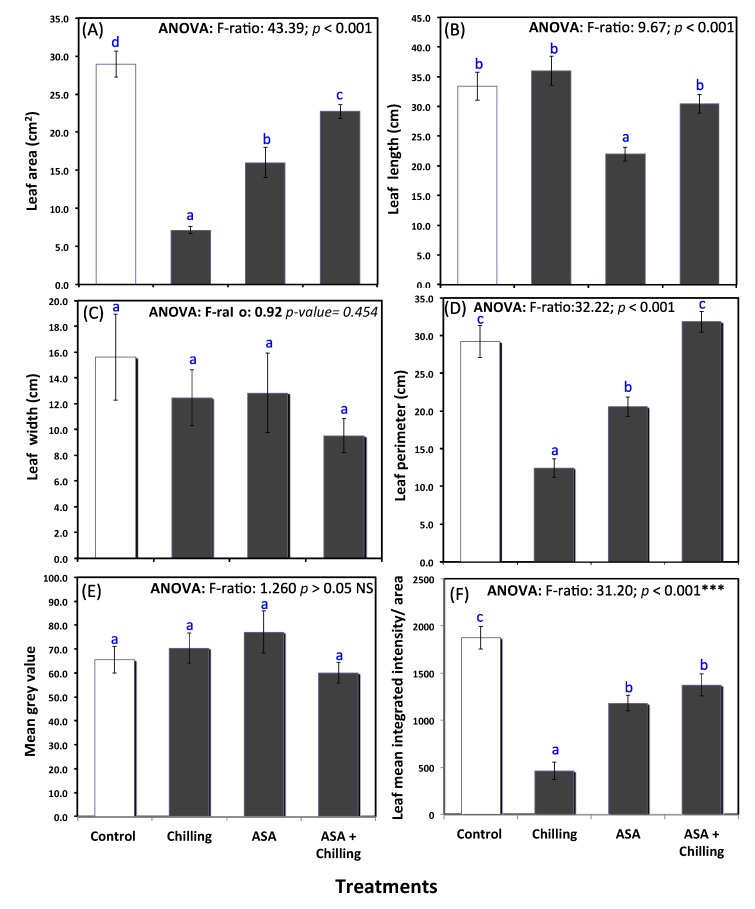
Figure 1.
Phenotypic measurements of tomato plants under chilling stress and pretreated with ascorbic acid (0.5 mM); (A) leaf area, (B) leaf length, (C) leaf width, (D) leaf perimeter, (E) mean grey value, and (F) leaf mean integrated intensity/area. Different lowercase letters indicate significant different according to one-way ANOVA and Duncan’s multiple range tests at p < 0.05.

