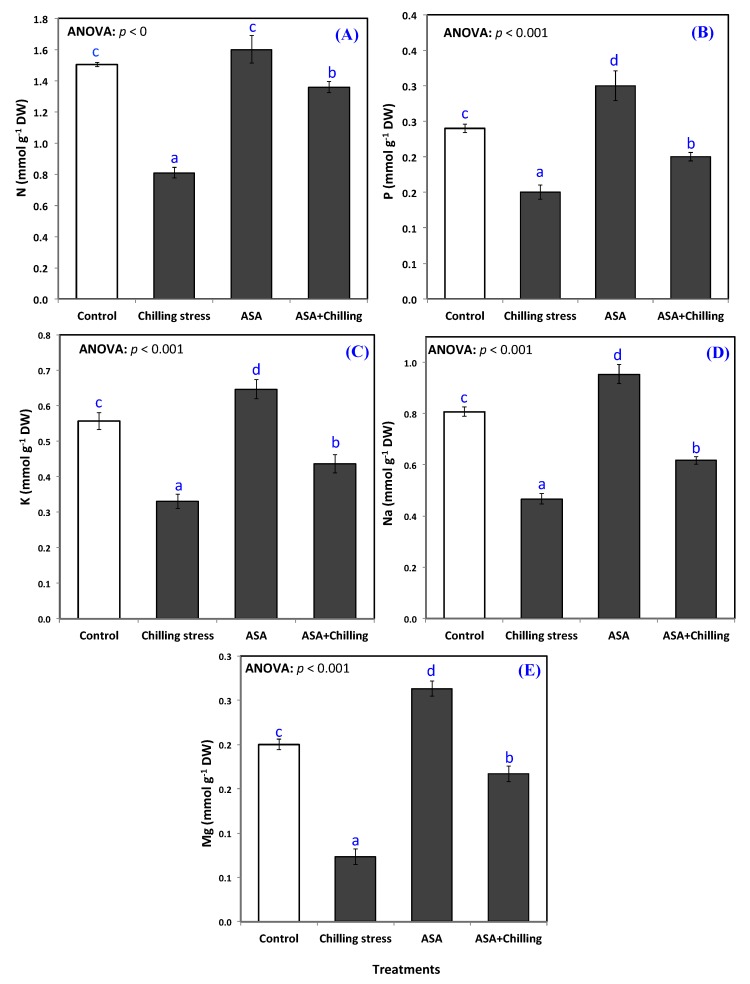
Figure 5.
Mineral ions content (A) N, (B) P, (C) K, (D) Na, and (E) Mg in tomato seedlings untreated (control group) and treated with chilling stress and ascorbic acid. Data plotted as mean and bars represent the standard error for mean. Bars expressed with different lowercase letters are significantly different according to DMRTs.

