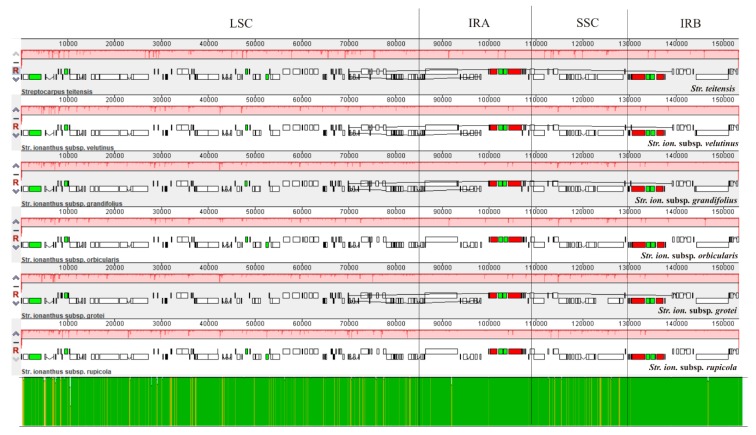
Figure 2.
Multiple genome alignment of six sect. Saintpaulia taxa. The red bars represent sequence similarity among different genomes. The bottom bar is a visualization of the sequences’ consensus identities with the green color symbolizing homology while the yellow vertical lines signify variation spots. LSC: Large Single Copy region; IRA: Inverted Repeat A; SSC: Small Single Copy region and IRB: Inverted Repeat B.

