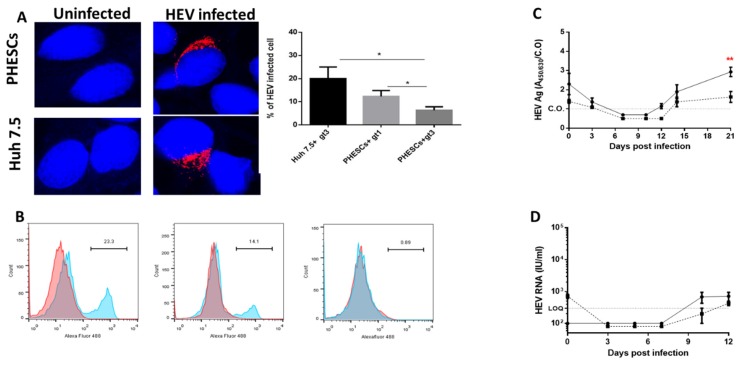
Figure 3.
Assembly of HEV capsid protein and release of the virus from PHESCs. (A) Endometrium stromal cells (upper panel) or Huh7.5 cells (lower panel) either uninfected (left side) or infected with HEV preparations (right side) were fixed and stained with anti-ORF2 Ab (1-E6 Ab) (red). DAPI was used for nuclear staining (blue) (Scale bars, 20 µm.). The percentage of infection was determined in Huh 7.5 challenged with HEV-3 and PHESCs challenged with HEV-1 and HEV-3. Depicted are the mean values of three independent experiments ± SD. * p < 0.05, as determined by the unpaired t-test. (B) Flow cytometry shows the expression of HEV ORF-2 in PHESCs infected with HEV-1 (left) and HEV-3 (middle) and compared to mock-infected cells (right). Red histograms represent cells stained with the secondary A488-conjugated anti-mouse antibodies alone; blue histograms represent cells stained by mouse anti-HEV-ORF2 followed by A488-conjugated anti-mouse antibody. (C) Supernatants collected from HEV-1- (solid line) and/or HEV-3- (dotted line) infected PHESCs were tested for HEV ORF2 Ag by ELISA, C.O. is the cut off. The mean level of HEV ORF2 Ag in the supernatant collected at day 21 post-infection from HEV-1-infected PHESCs was compared with the level of HEV ORF2 Ag in the supernatant collected at the same time point from HEV-3-infected PHESCs. Depicted are the mean values of three independent experiments ± SEM. ** p < 0.01, as determined by the unpaired t-test. (D) Naive PHESCs were inoculated with cell lysate of HEV-1. HEV RNA load was quantified in these samples by qPCR. The solid line represents the intracellular HEV RNA load, the dotted line represents extracellular RNA load, and LOQ is the limit of quantification. Depicted are the mean values of three independent experiments ± SEM.

