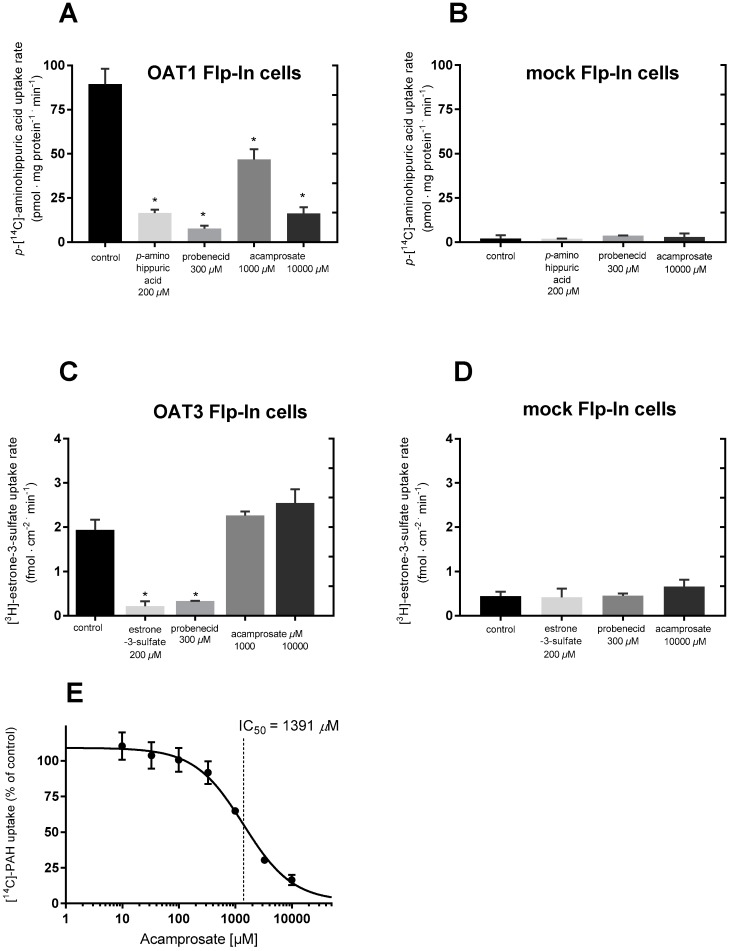
Figure 4.
Evaluating the potential of acamprosate to inhibit substrate transport via OAT1/3 carriers. The uptake rate of p-[14C]-aminohippuric acid or [3H]-E3S in HEK293-Flp-In OAT1 or HEK293-Flp-In OAT3 expressing cells, respectively, compared with HEK293-Flp-In mock cells. The uptake rate of 9.5 µM (0.5 µCi/mL) [14C]-PAH was measured in the absence (control) or presence of 200 µM non-labelled p-aminohippuric acid, 300 µM probenecid or 1000 or 10,000 µM acamprosate in HEK293-Flp-In cells: (A) stably overexpressing the OAT1 carrier; (B) mock transfected. The uptake rate of 0.02 µM (1 µCi/mL) [3H]-estrone-3-sulfate in the absence (no inhibitor) or presence of 200 µM non-labelled estrone-3-sulfate, 300 µM probenecid or 1000 or 10,000 µM acamprosate into HEK293-Flp-In cells: (C) stably overexpressing the OAT3; (D) mock transfected cells (E): effect of 0–10,000 µM acamprosate on the uptake rate of 9.5 µM [14C]-PAH (% of control) in HEK293-Flp-In OAT1 expressing cells. The solid line is a fit of the data to Equation (3). Each bar depicts the mean ± SEM of replicates in three cell passages. (A,B,E) were obtained at Lab. 1, while (C,D) were obtained in Lab. 2. Differences as compared with the uptake rate in the control are indicated (* p ≤ 0.05).

