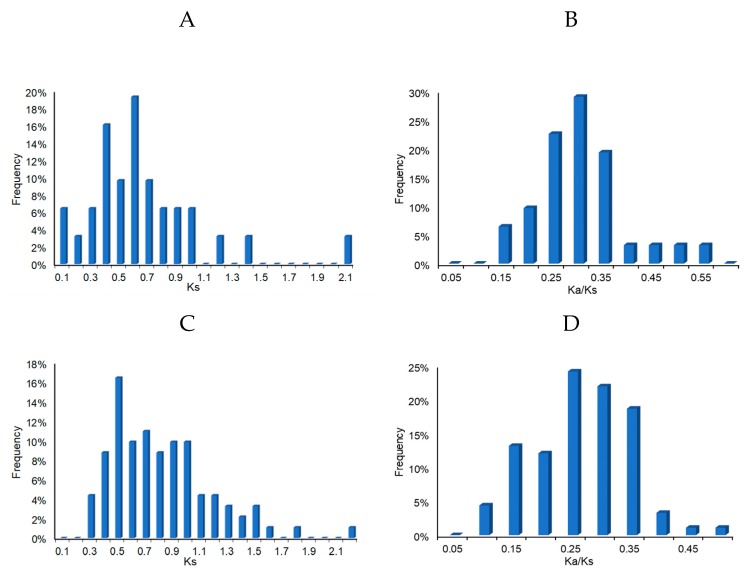
Figure 8.
Ks and Ka/Ks value distributions of the AP2/ERF family genes in the genomes of A. nanus and Glycine max. Distribution of Ks and Ka/Ks values were calculated from the paralogous gene pairs in the A. nanus genome (A and B), and the orthologous gene pairs between the A. nanus and G. max genomes (C and D). Four orthologous gene pairs with Ks > 2.5 were not used for preparing the above figure.

