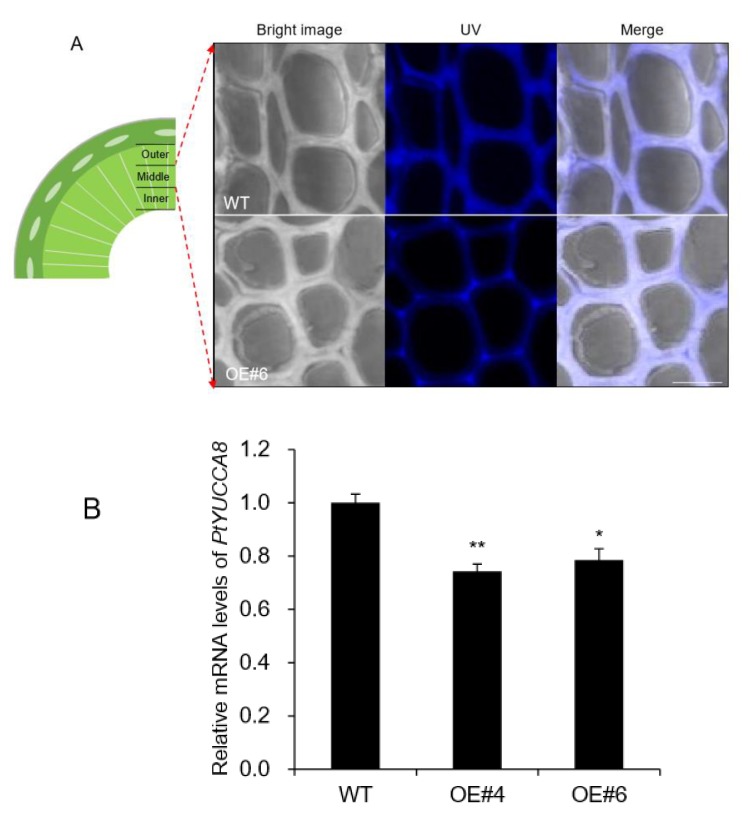
Figure 7.
The middle xylem layer was altered in AtpPLAIIIα-OE. (A) Enlarged images of portions of the middle xylem showed that the cell walls were thickened in OE, whereas the UV autofluorescence signal was weakened compared to that of WT. Bright image, UV, and merged images of WT and OE were displayed. Bar = 10 μm. (B) Expression levels of PtYUCCA8 in basal xylem part of stem in WT and AtpPLAIIIα-OE. Each datum represents the average ± SE from three independent replicates at P < 0.05 (*) and P < 0.01 (**), respectively.

