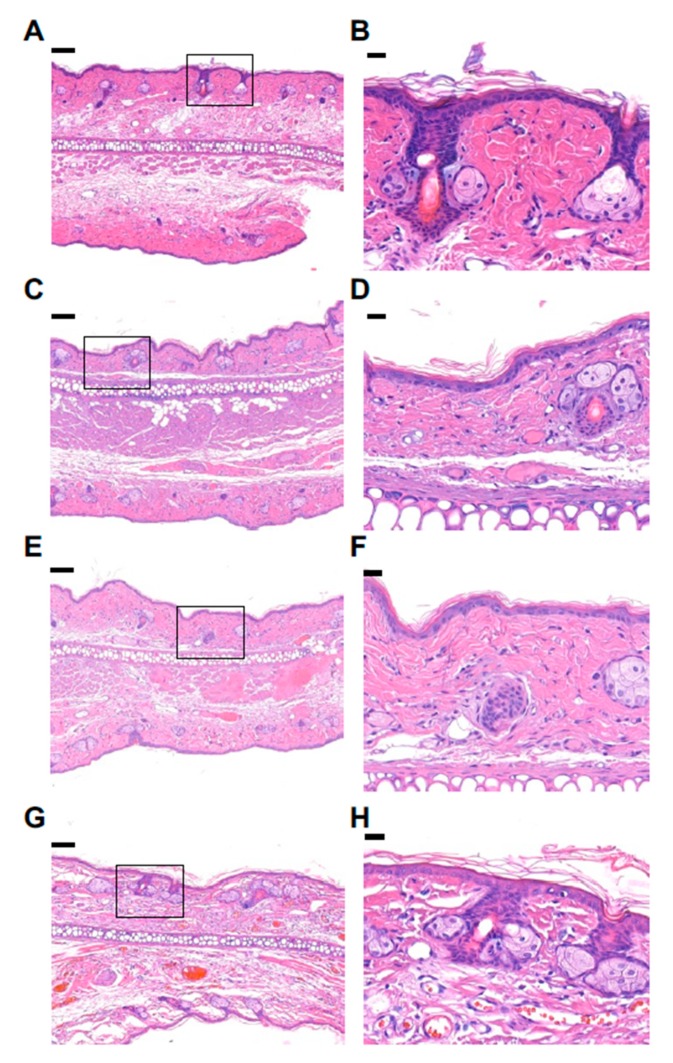
Figure 5.
Representative Haemotoxylin & Eosin stained histology sections of the ear after DMN patch application. The left column shows ear sections after 120 min of DMN patch application. The right column represents the patch application site (the rectangular sub-sections shown in the left column) (A,B) DMN patch containing maximal dose (331.20 μg) of lidocaine-HCl (C,D) DMN patch containing a half-maximal dose (165.60 μg) of lidocaine-HCl (E,F) DMN patch containing a quarter maximal dose (82.80 μg) of lidocaine-HCl (G,H). Blank DMN patch without lidocaine-HCl. Red arrows indicate DMN insertion sites. Scale bar indicates 100 μm and 20 μm in the left and the right column, respectively.

