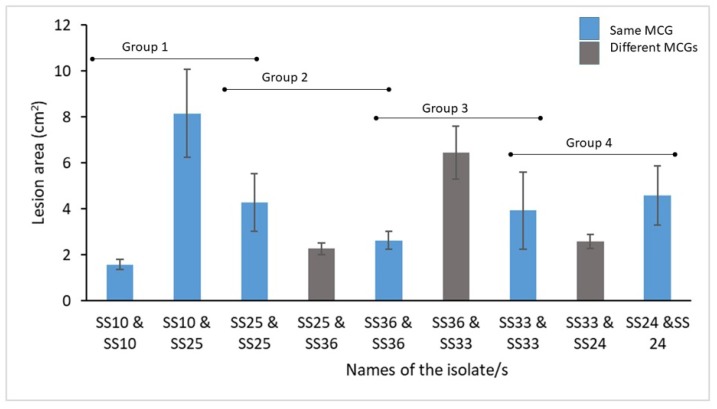
Figure 3.
Bar graph showing the variation in lesion areas (cm2) of cabbage leaves inoculated with one or two different isolates of Sclerotinia sclerotiorum. Isolates of the same mycelial compatibility group (MCG) are shown in blue color whereas the isolates of different MCGs are shown in ash color. Whiskers indicate one standard error of the mean. X axis shows the names of S. sclerotiorum isolates.

