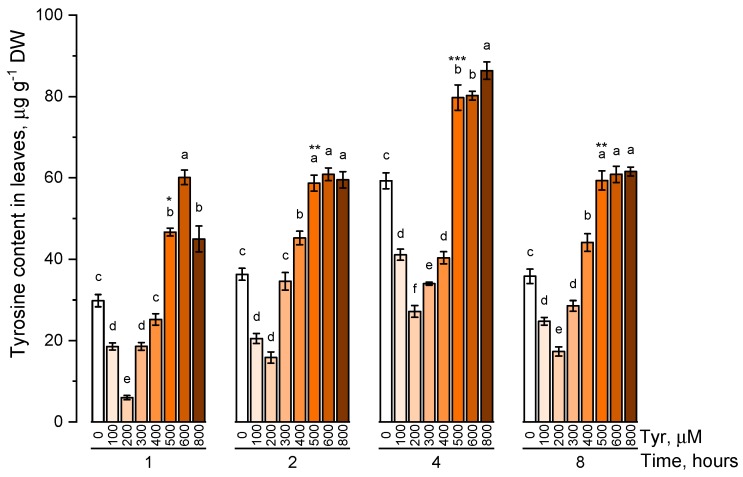
Figure 2.
Intracellular content of free tyrosine in common wheat incubated on tyrosine-enriched medium containing various concentrations of the amino acid (100, 200, 300, 400, 500, 600, and 800 μM) for 1, 2, 4, 8 h. Bars marked with different letters show significant differences for the defined time of cultivation with tyrosine; asterisk * indicates significant differences among plants exposed for a different time at 500 μM (p ≤ 0.05, Tukey’s test).

