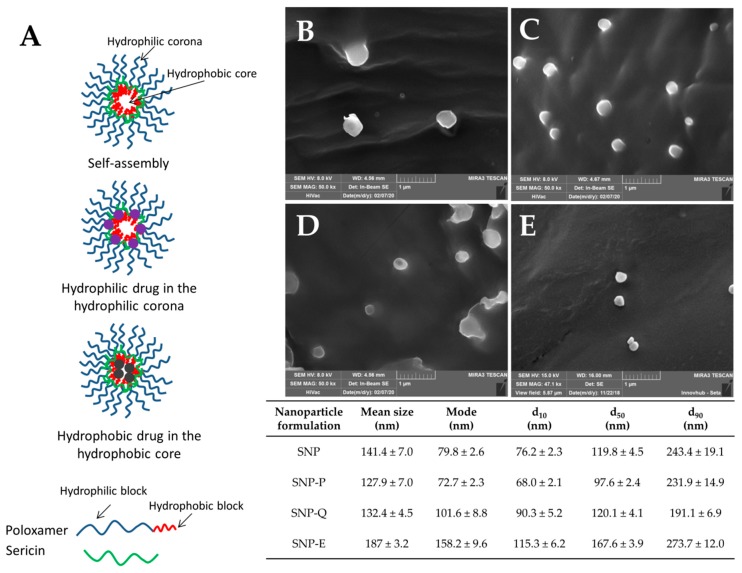
Figure 1.
(A) Proposed structure for silk sericin nanoparticles (SNPs). SEM images and particle size distribution of SNP-P (B), SNP-Q (C), SNP-E (D) and SNP (E). Scale bar 1 µm. Nanoparticle tracking analysis (NTA) results are reported as mean, mode, d10, d50 and d90 values, all of them ± standard error, n = 5. Statistical analysis revealed no significant differences in particle size and particle size distribution among the different formulations (p > 0.05).

