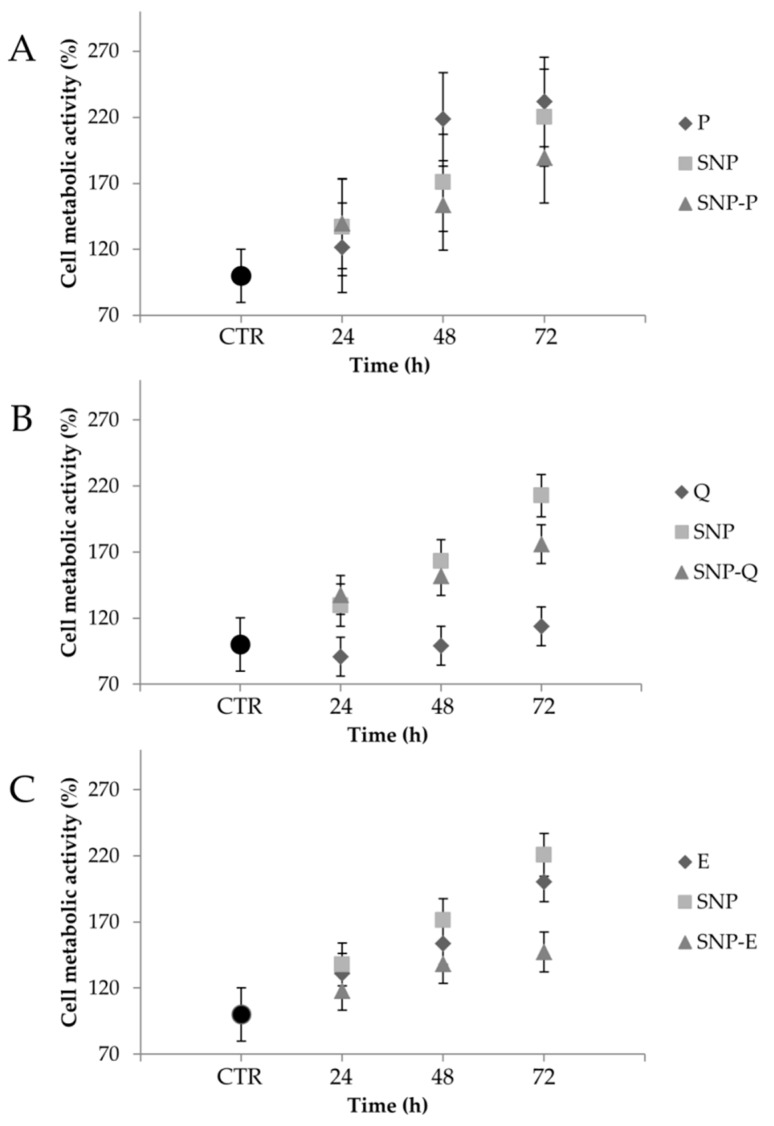
Figure 7.
Cell metabolic activity % of mesenchymal stem/stromal cells (MSCs) treated with the highest dosage (0.8 mg/mL) of SNP, SNP-P (A), SNP-Q (B) and SNP-E (C), and the equivalent amount of free drug (P, Q and E). Untreated cells were considered as CTR (100% of metabolic activity). Multifactor ANOVA, mean values ± least significant difference (LSD), n = 3.

