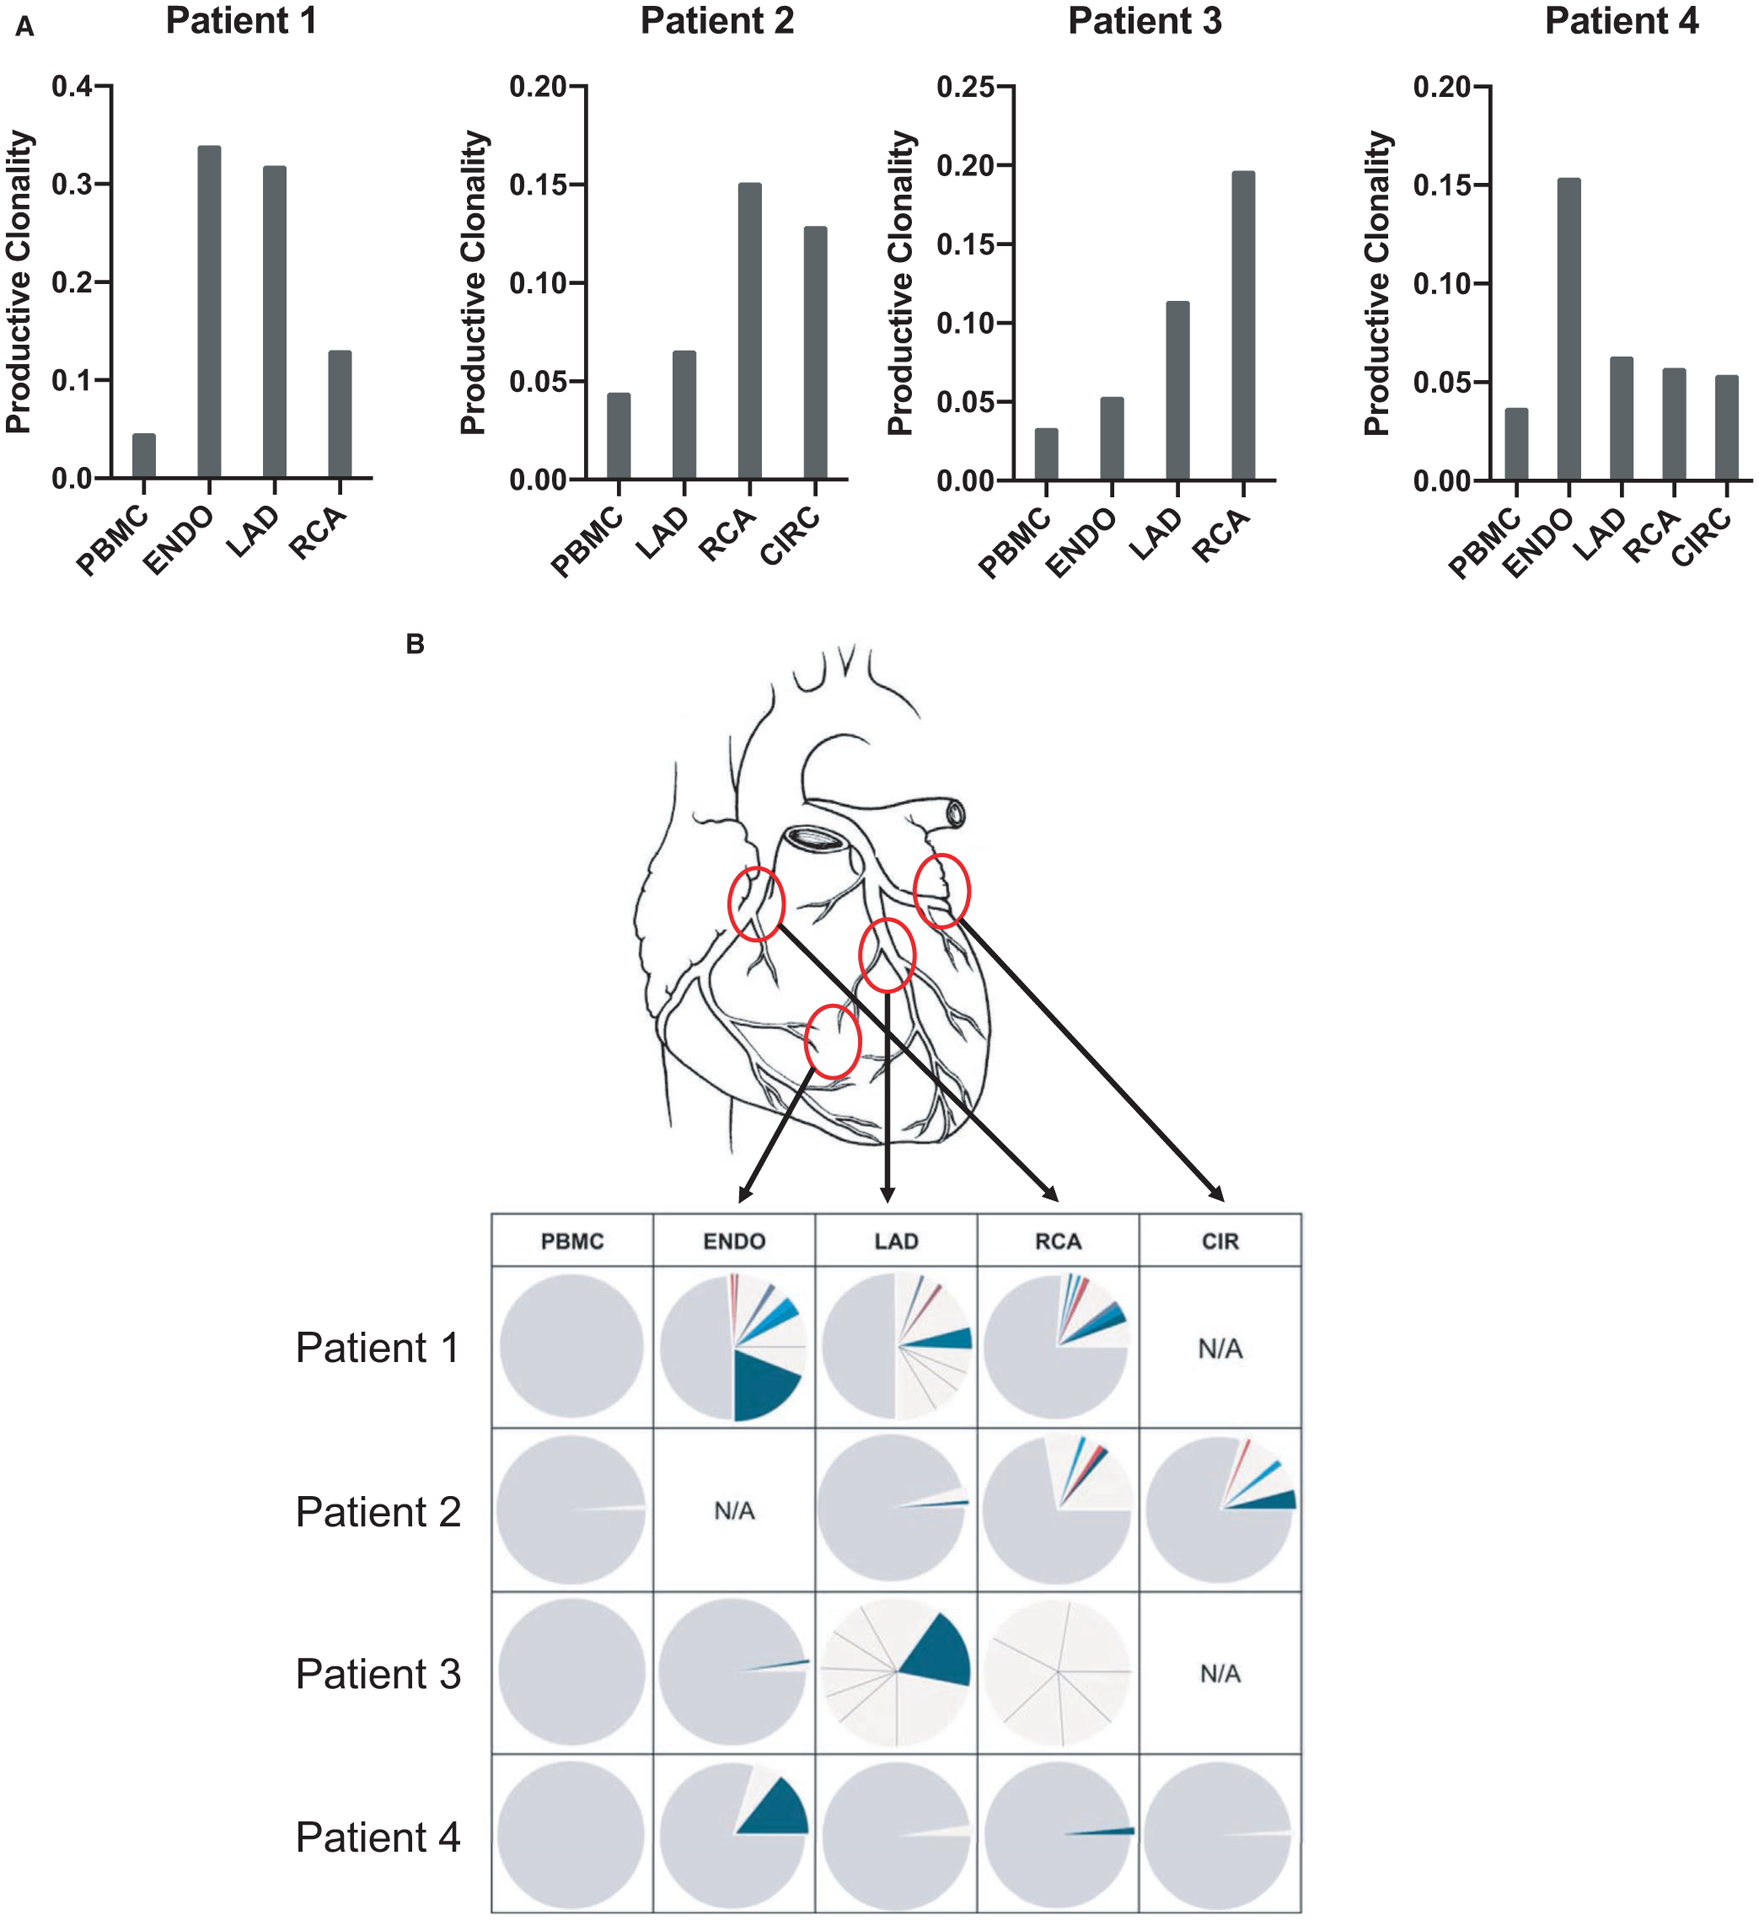
FIGURE 1.

B cell repertoire analysis in graft infiltrates and peripheral blood. A, IGH clonality of graft locations and blood for 4 transplant recipients with active CAV, calculated from productive rearrangements by taking the inverse of the normalized (for sequencing depth) Shannon diversity index. B, Pie chart representation of the frequency of individual CDR3 sequences observed in 4 distinct allograft sites and in the blood for 4 explants. Each pie section corresponds to a unique CDR3 sequence with a frequency above 1%. Sections corresponding to sequences present at less than 1% are merged and depicted as gray. The noncolored sections correspond to clones that were only detected in the indicated location. Colored pie chart sections (blue, red…) correspond to clones that were detected in more than one locale within the graft. CAV, cardiac allograft vasculopathy; ENDO, endocardium; LAD, left anterior descending coronary artery; RCA, right coronary artery; CIR, circumflex coronary artery
