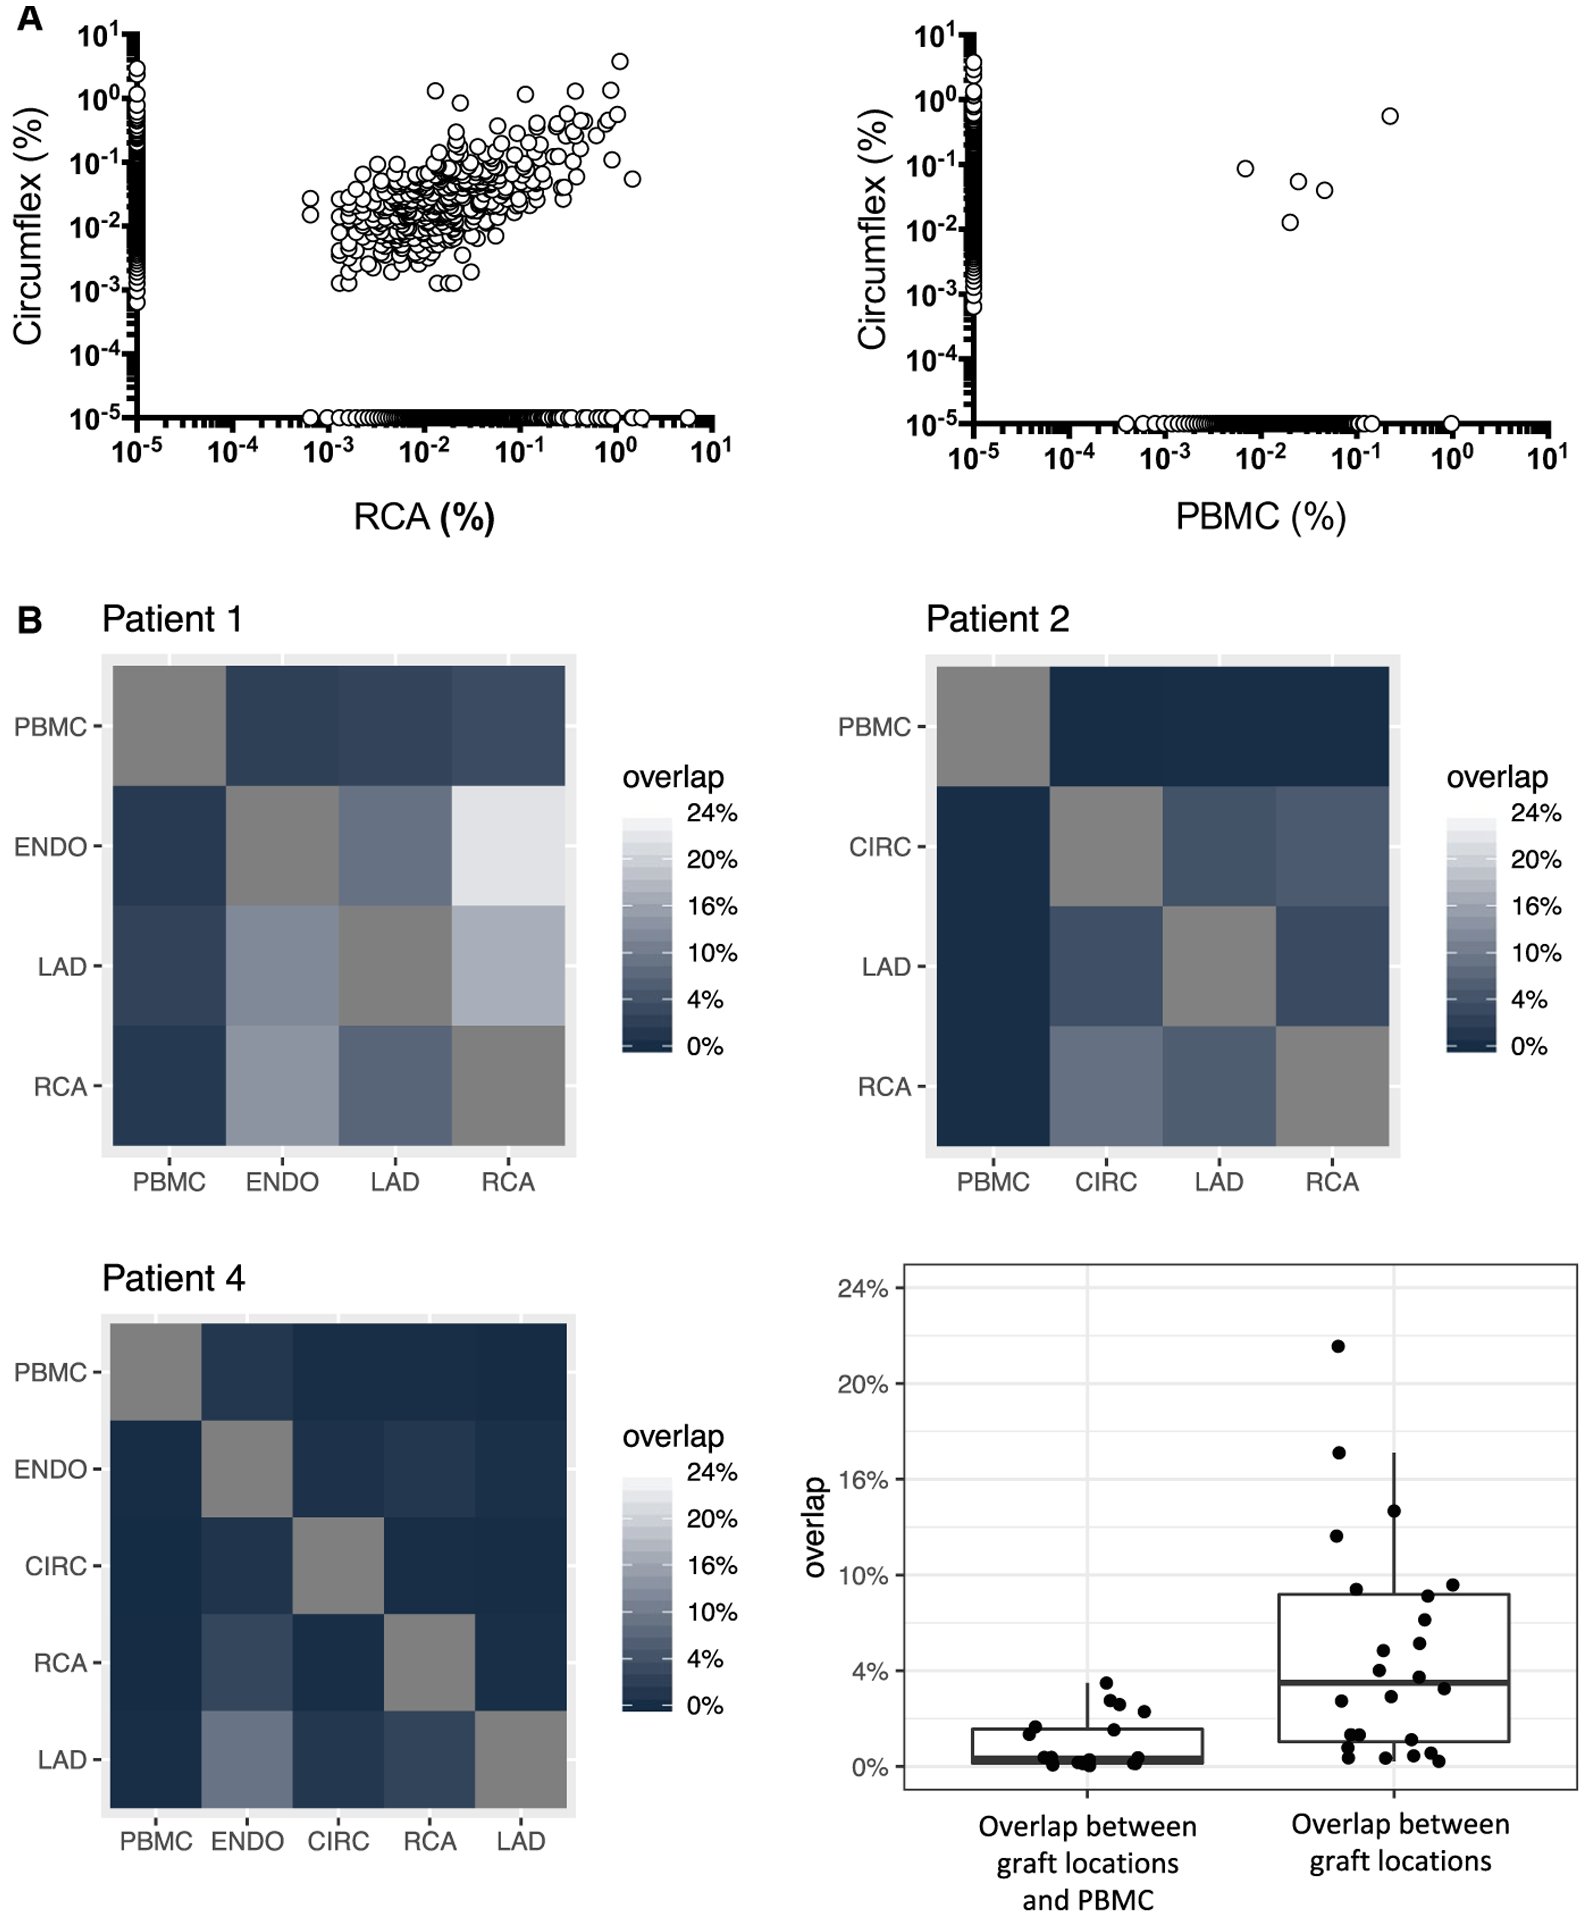
FIGURE 2.

Overlap between B cell repertoires. A, Example of IGHV sequence repertoire overlap between 2 distinct locations within the same graft (RCA and CIR, left panel) and between the graft and PBMC (right panel) for patient 2. Each dot represents a unique sequence. The frequency of each sequence is reported on the x and y axes. Sequences along the x and y axis were detected in only one compartment. B, Summary of the CDR3 productive rearrangements repertoire overlap between the different graft locations and blood for 3 patients. The percentage corresponds to CDR3 sequences from the locations shown on the y-axis that are also found at the location shows on the x-axis. Note that for patient 3, the number of sequences obtained for the coronary arteries was not sufficient to calculate the repertoire overlap. The box-whisker plot shows the distribution of overlaps between graft locations and PBMC (left) or between different graft locations (right). CIR, circumflex coronary artery; IGHV, immunoglobulin heavy chain variable; PBMC, peripheral blood mononuclear cells; RCA, right coronary artery
