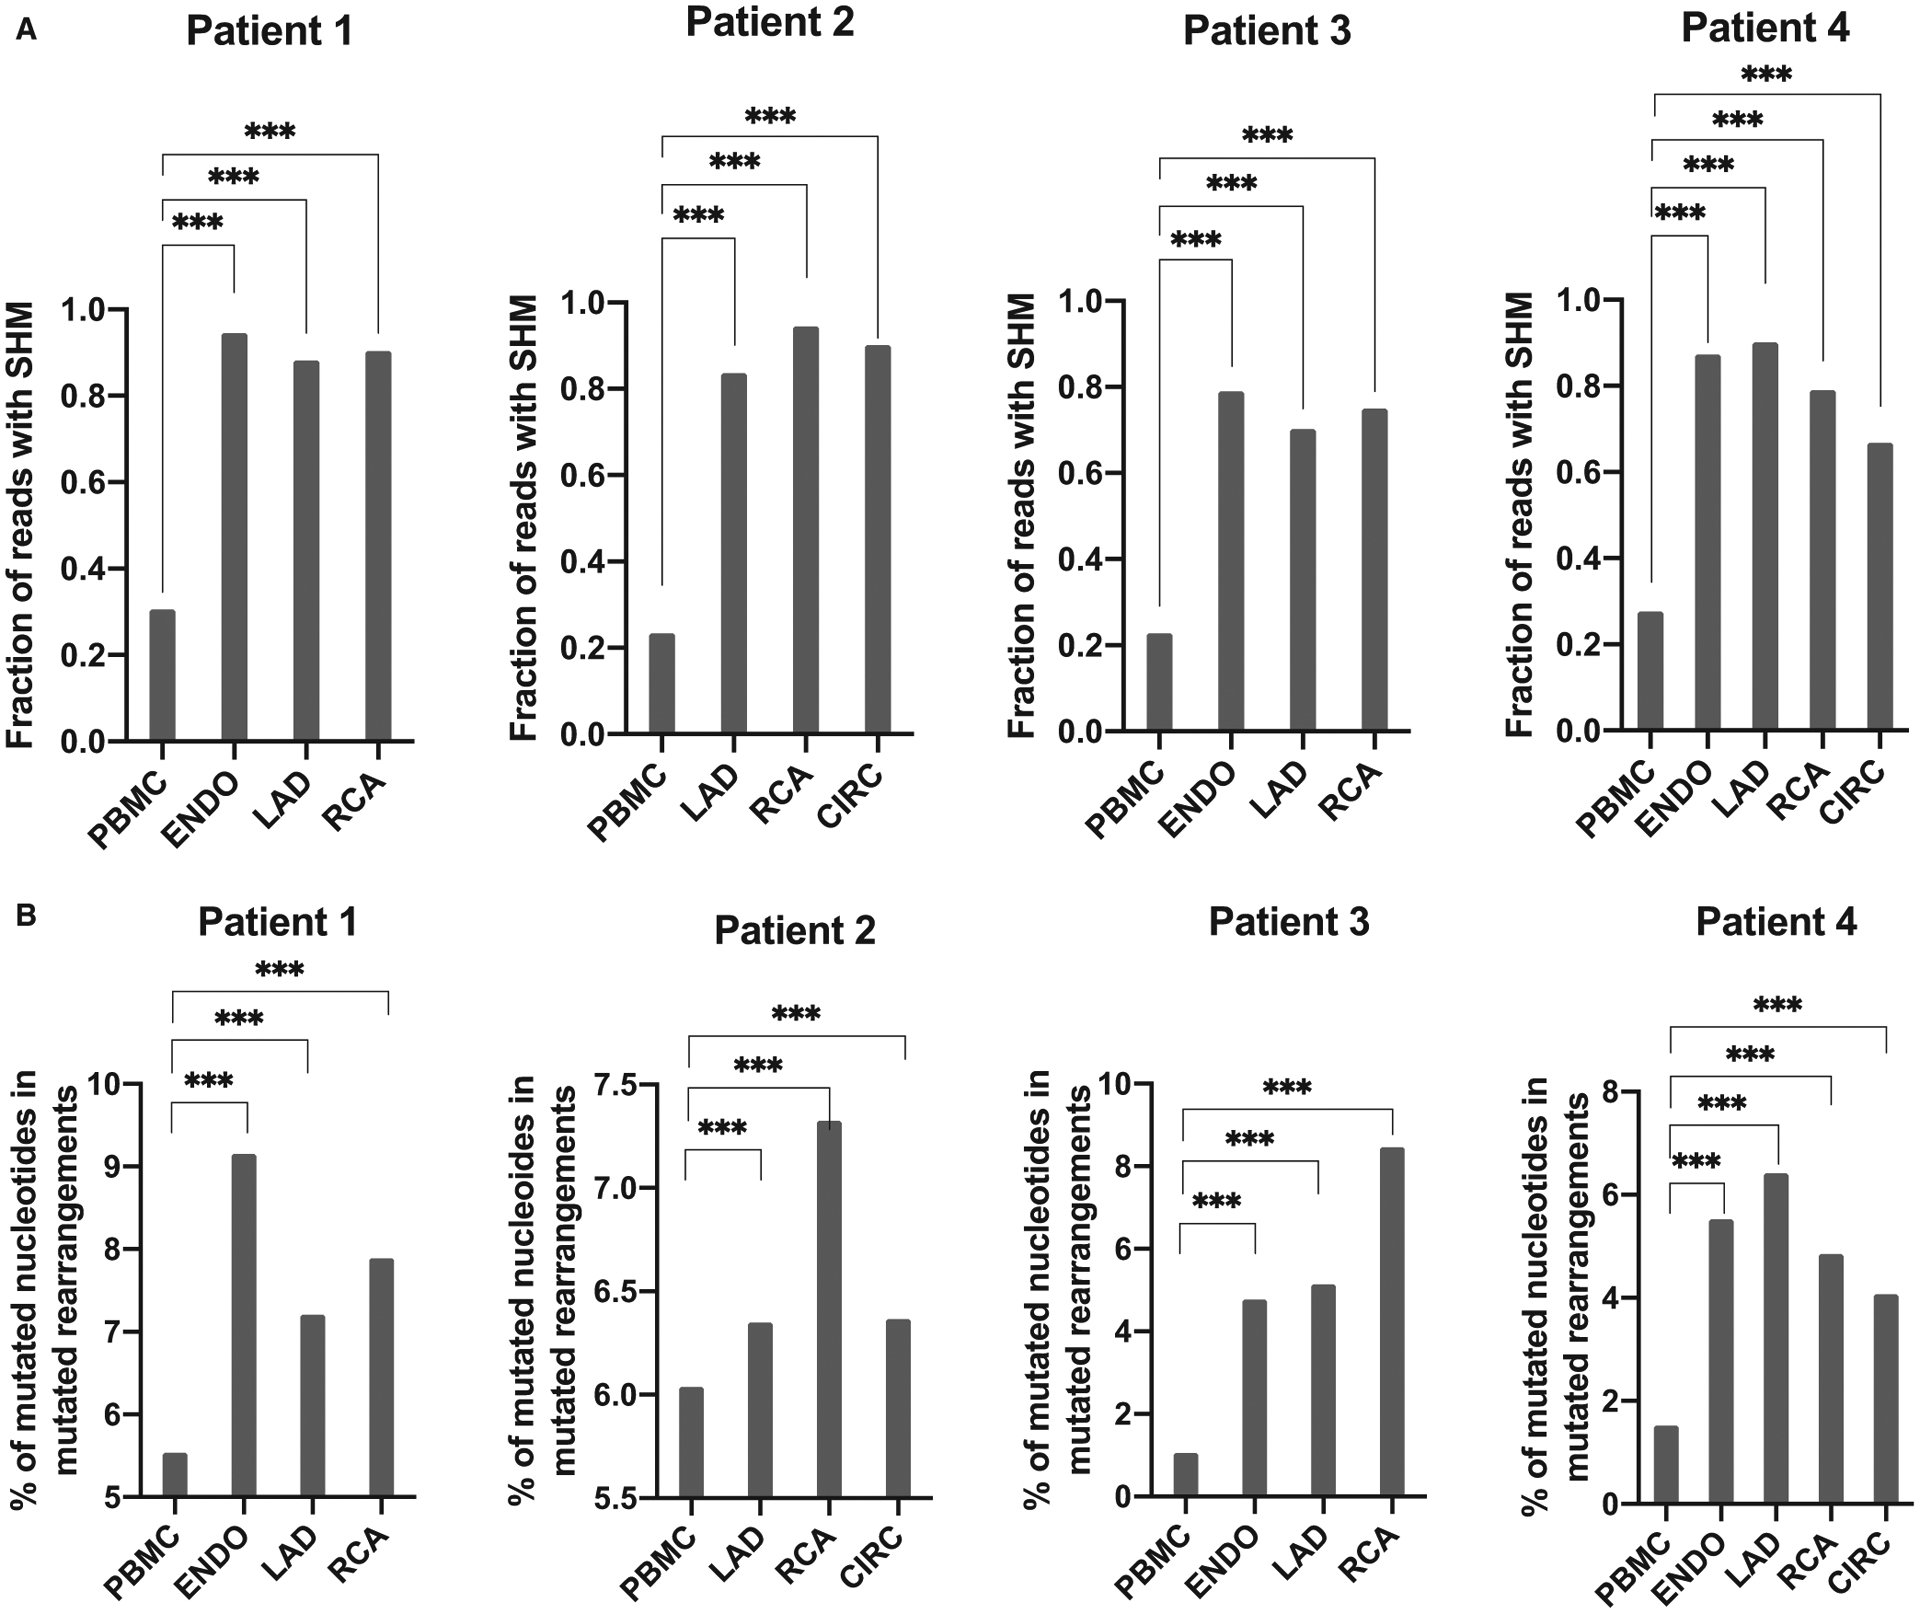
FIGURE 3.

Blood and intragraft B cell IGHV mutation rates. A, Overall percentage of productive rearrangements with SHM for all graft locations and blood for the 4 patients. B, Average percentage of mutated nucleotides among productive mutated rearrangements. Differences between locations were assessed using a two-tailed Mann-Whitney test (***P < .001). IGHV, immunoglobulin heavy chain variable; SHM, somatic hypermutations
