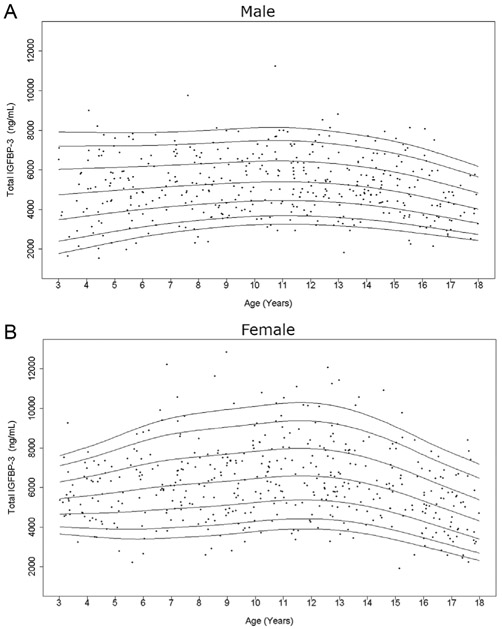
Figure 3.
Cross-sectional measurements of serum total IGFBP-3 in the study population. Age distribution of serum total IGFBP-3 levels in males (A) and females (B) are represented respectively. The curves of the 5th, 10th, 25th, 50th, 75th, 90th, and 95th percentiles of total IGFBP-3 value calculated by BCT method are displayed.

