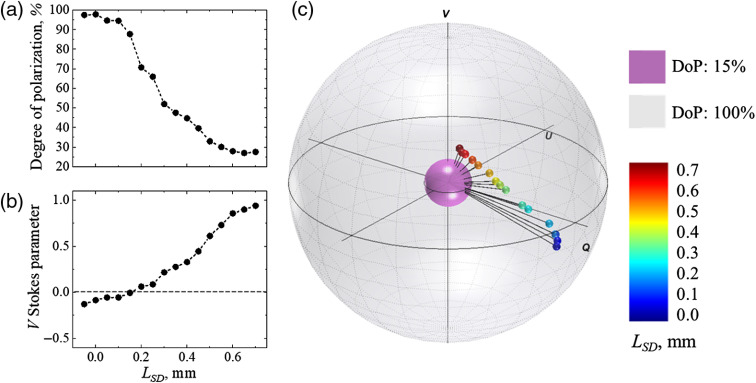
Fig. 2.
Impact of the variation of the source–detector separation on: (a) DoP, (b) Stokes parameter, and (c) Stokes vector mapped on the Poincaré sphere with respect to the DoP. The radii of the outer (gray) and inner (purple) spheres correspond to 100% and 15% DoP, respectively. The color map from blue to red corresponds to the increase of the source–detector separation. Video 1 shows the Poincaré sphere rotating around axis for better understanding of the positions of the Stokes vectors tips inside the Poincaré sphere (Video 1, mp4, 4 Mb [URL: https://doi.org/10.1117/1.JBO.25.5.057001.1]).

