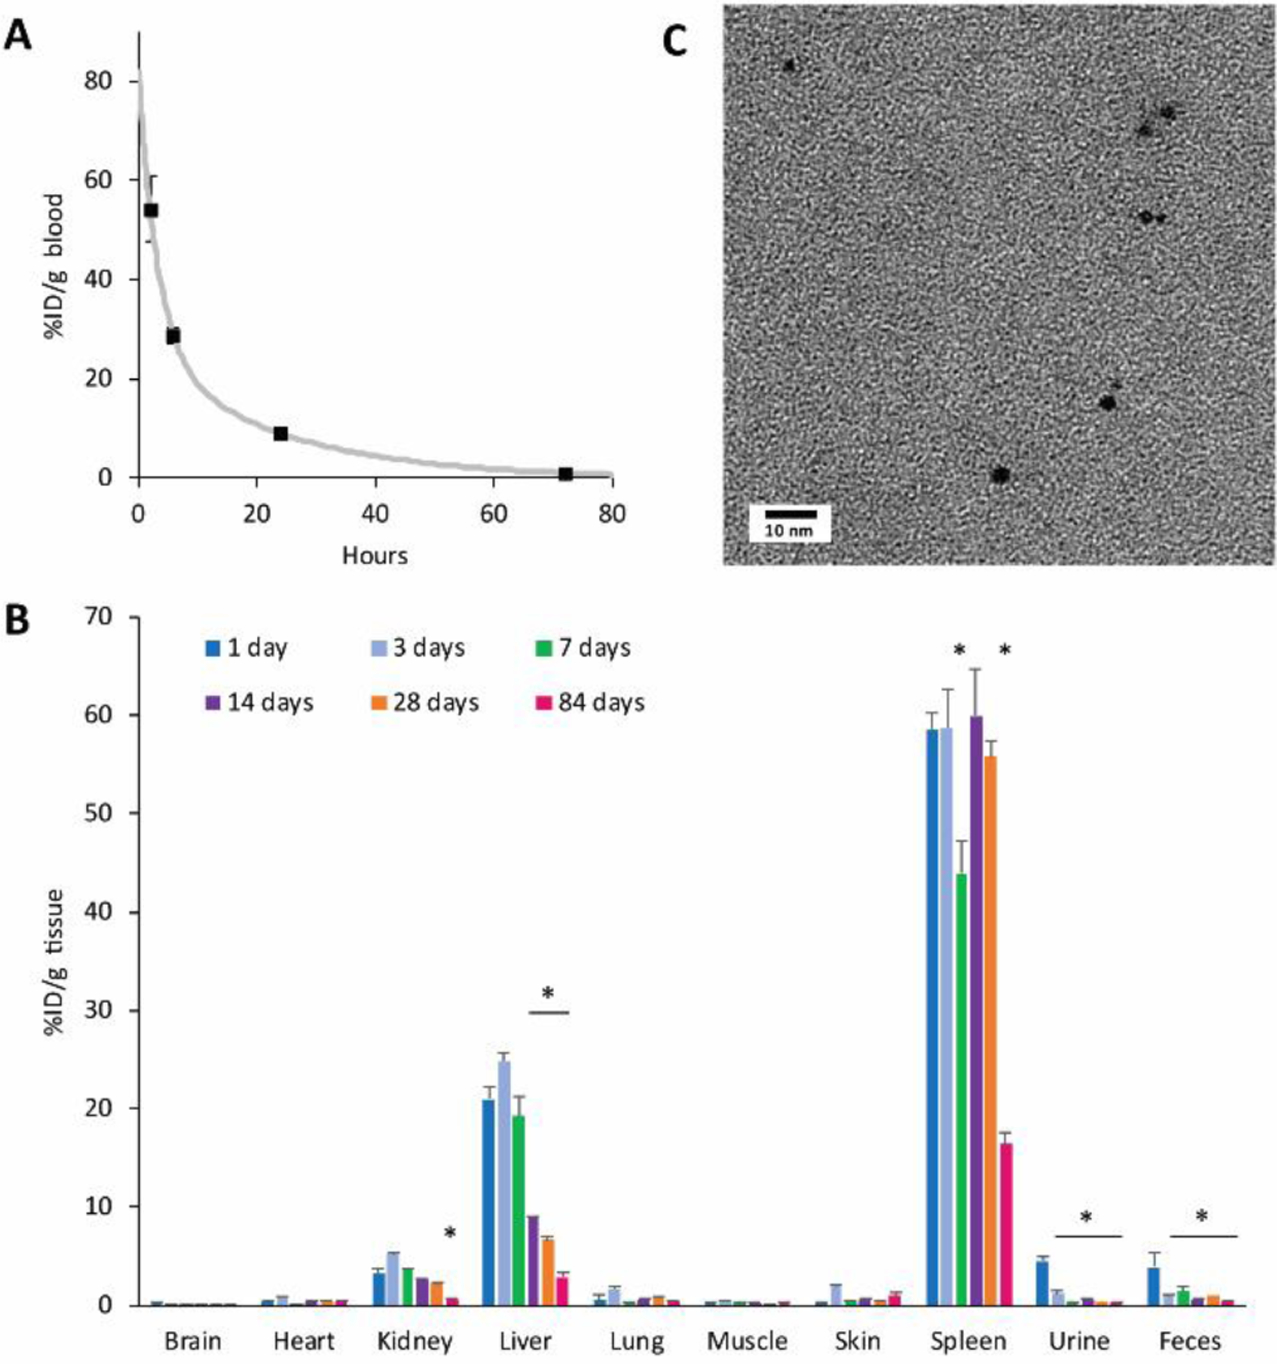
Figure 6.

In vivo pharmacokinetics and biodistribution of ADAMs. Mice were injected intravenously with 100 mg Au per kg body weight, and samples were collected at various timepoints post-injection (n = 3 mice per timepoint, expressed as average ± SEM). (a) Blood samples were analyzed by ICP-OES to determine gold content; curve-fitting was performed using MATLAB software. (b) Tissue and fluid samples were analyzed by ICP-OES to determine gold content (n = 3 mice per timepoint, expressed as average ± SEM.) Note that feces and urine values represent samples collected on the day of sacrifice, and do not represent the cumulative excretions between timepoints. Statistical comparison was performed using one-way ANOVA with post-hoc Tukey HSD test; *p < 0.05 relative to measurement at 1 day. (c) Urine was collected at 24 hours post-injection, diluted 1:1 in pure water, and imaged by electron microscopy. Electron-dense 2-nm particles are consistent with the appearance of Dextran-AuNPs.
