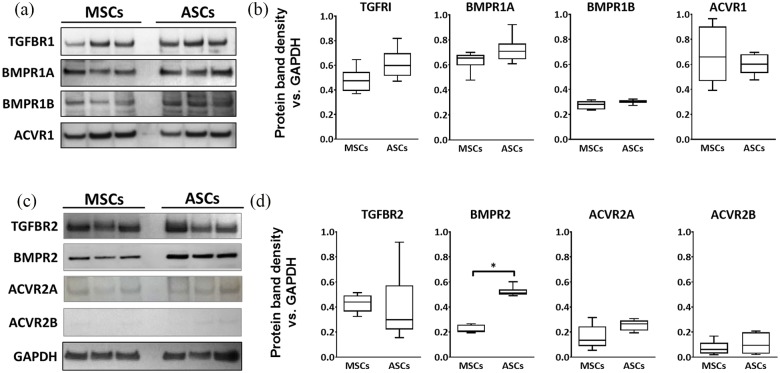
Figure 1.
(a) Western blot images and (b) densitometric analysis comparing the expression of type I TGF/BMP receptors between donor-matched MSCs and ASCs. (c) Western blot images and (d) densitometric analysis comparing type II TGF/BMP receptors between donor-matched MSCs and ASCs. GAPDH expression in samples was used an internal loading control. Blots show representative comparisons for three donor-matched populations. Densitometric data show mean values ± SEM. (n = 6; *p < 0.05). Receptor profiles for BMP receptors showed similar expression for MSCs and ASCs, with the exception of BMPR2, which was significantly higher in ASCs.

