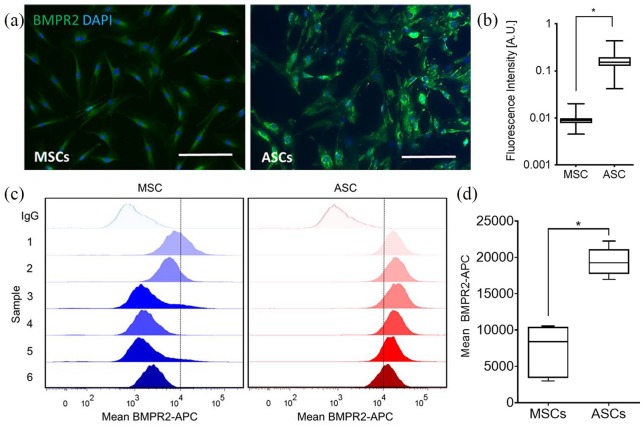
Figure 2.
(a) Representative immunofluorescence images and (b) quantification of fluorescence intensity (CellProfiler Software) comparing BMPR2 (Alexa488) expression between MSCs and ASCs in vitro (n = 3; *p < 0.001). Nuclei stained with DAPI. Scale bars = 200 µm. Expression of BMPR2 was observed to be greater in ASCs compared to MSCs. (c) Flow cytometric analysis of donor-matched MSC and ASC populations stained with BMPR2-APC. One representative isotype control is shown for each cell type for clarity. (d) Mean population fluorescent intensity shown graphically; ASCs showed significantly higher staining intensity for BMPR2 in comparison to MSCs, with less variation in mean expression observed (n = 6; *p < 0.01).

