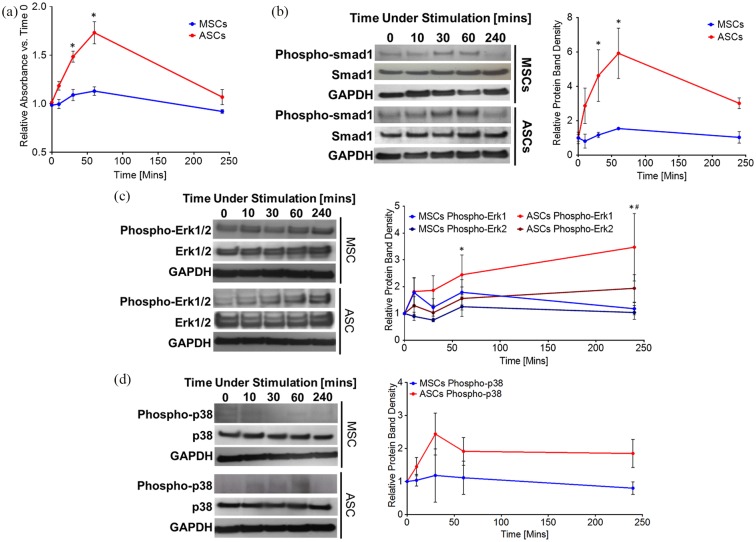
Figure 3.
(a) Phospho-SMAD1 ELISA comparing donor-matched MSCs and ASCs over a 4-h rhGDF6 stimulation time-course. MSCs and ASCs were serum starved and then stimulated with serum-free media containing 100 ng mL−1 rhGDF6. Data shown are mean values ± SEM. (n = 3 in independent triplicates; *p < 0.05). (b) Representative western blot images and (c) densitometric quantification of phospho-SMAD1 expression in donor-matched MSC and ASC populations over a 4-h rhGDF6 stimulation time-course. Quantification data shown are mean values ± SEM. (n = 3; *p < 0.05). (d) Representative western blot images of ERK1/2 and P38 phosphorylation following stimulation with 100 ng mL−1 rhGDF6 in donor-matched MSCs and ASCs over a 4-hour rhGDF6 stimulation time-course (e) Densitometric analysis of western blot of phosphorylation of ERK1/2 and P38 following stimulation with 100 ng mL−1 rhGDF6 in donor-matched MSCs and ASCs over a 4-hr rhGDF6 stimulation time-course. Data shown are mean values ± SEM (n = 3; *p < 0.05 ERK1 ASC vs. ERK1 MSC; #p < 0.05 ERK2 ASC vs. ERK2 MSC).

