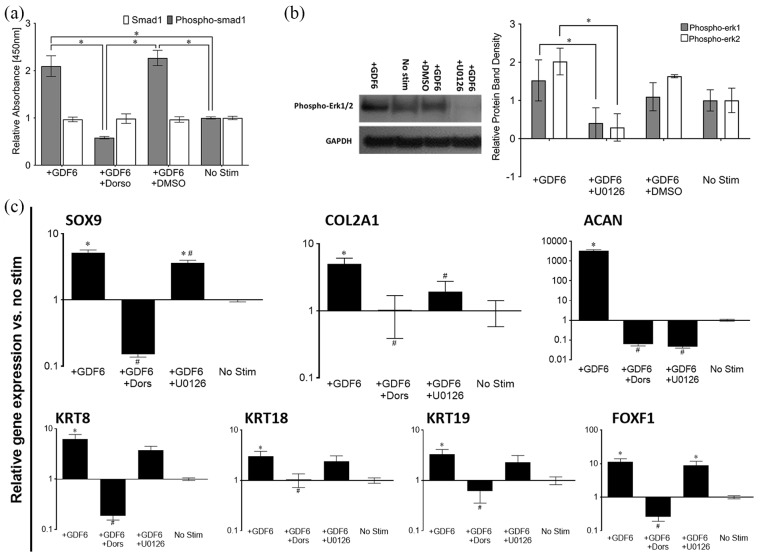
Figure 4.
(a) Phospho-SMAD1 ELISA analysis of dorsomorphin (Dorso) blocking of rhGDF6-mediated SMAD1 phosphorylation following stimulation with 100 ng mL−1 rhGDF6. Data shown are mean values ± SEM (n = 3; *p < 0.05). Phospho-SMAD1 ELISA shows rhGDF6-induced phosphorylation of SMAD1 after 60 min stimulation with 100 ng mL−1 rhGDF6, which is returned to control levels with addition of 10 µM dorsomorphin. (b) Representative western blot analysis showing effective blocking of ERK1/2 phosphorylation in ASCs by culture with 10 µM U0126 and densitometric analysis of western blots of ERK1/2 phosphorylation inhibition in ASCs following 100 ng mL−1 rhGDF6 stimulation. Data shown are mean values ± SEM. (n = 2; *p < 0.05). rhGDF6 effectively induces ERK1/2 phosphorylation after 60 min culture with 100 ng mL−1 rhGDF6, which is abrogated by culture with U0126. (c) Quantitative real-time PCR analysis of healthy NP-marker gene expression in ASCs after 14 days of 3D collagen gel culture with 100 ng mL−1 rhGDF6 stimulation with and without SMAD1/5/8 inhibition (dorso) or ERK1/2 inhibition (U0126). Relative gene expression was normalized to mean housekeeping gene expression and fold change calculated vs. no stimulation control cells (n = 3 donor populations in triplicate; data represents mean ± SEM; *p < 0.05 vs rhGDF6 stimulated cells).

