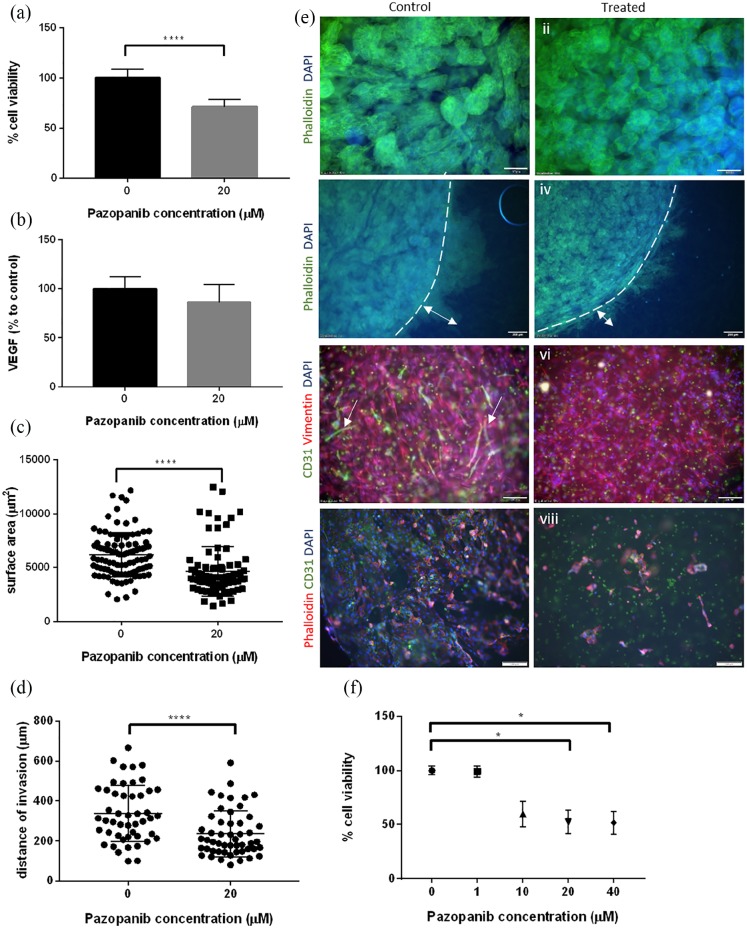
Figure 6.
Pazopanib treatment of complex tumouroid manufactured using 786-O, HUVEC and HDF cells. (a) Cell viability (CellTiter Glo) following 7 days of treatment. (b) VEGF levels (% to control) in the supernatant following treatment measured by ELISA. (c) Surface area of spheroids within cancer mass in control and treated complex tumouroids. (d) Distance of invasion of 786-O cells within the stromal compartment in control and treated complex tumouroids. (e) Representative immunofluorescent images of control (left panel) and treated (right panel) cultures. (i–vi) Complex tumouroids and (vii–viii) HUVEC only; dotted line shows (iii, iv) cancer mass boundary and arrows indicate (iii, iv) 786-O invasion and (v) endothelial networks (scale bar = 100 µm in i, ii, v, vi, vii, viii; 200 µm in iii, iv). (f) Control cultures of HUVEC only, treatment on day 10 for 120 h.
****p < 0.0001; *p < 0.05 (a, b, c, d), Mann–Whitney U and (f) Kruskal–Wallis with Dunn’s post hoc analysis.

