Figure 9.

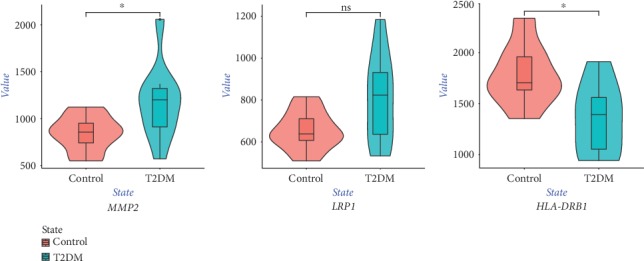
Violin plot of the expression level of key genes. The red violin reflects the control group, and the green violin reflects the T2DM group. ∗P < 0.05.

Violin plot of the expression level of key genes. The red violin reflects the control group, and the green violin reflects the T2DM group. ∗P < 0.05.