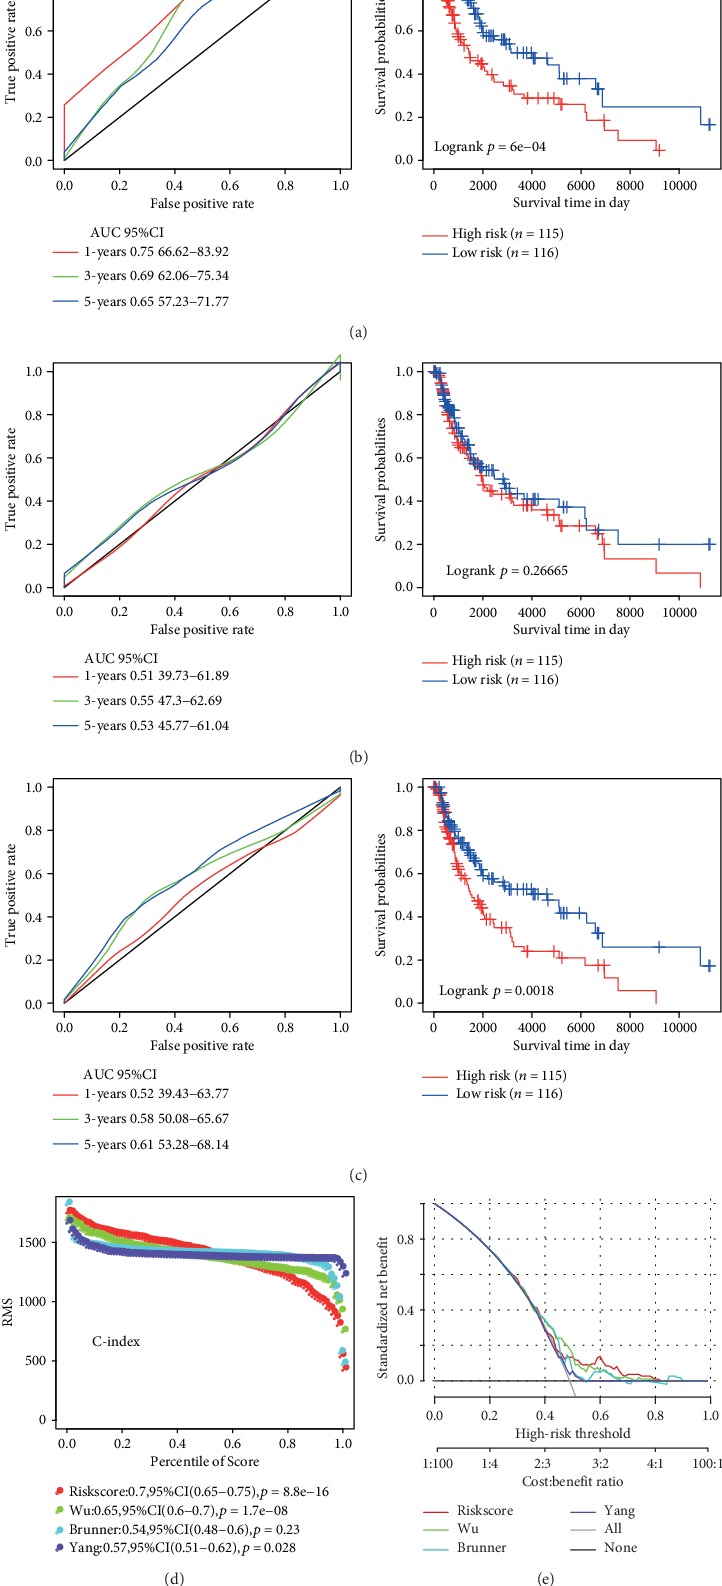
Figure 10.

Comparison and analysis between the 6-gene signature model and other existing models. (a) AUC and KM curve of Wu's model. (b) AUC and KM curve of Brunner's model. (c) AUC and KM curve of Yang's model. (d) Three models and the RMS curve of the 6-gene signature. (e) DCA curve of the RMS curve of the three models and the 6-gene signature.
