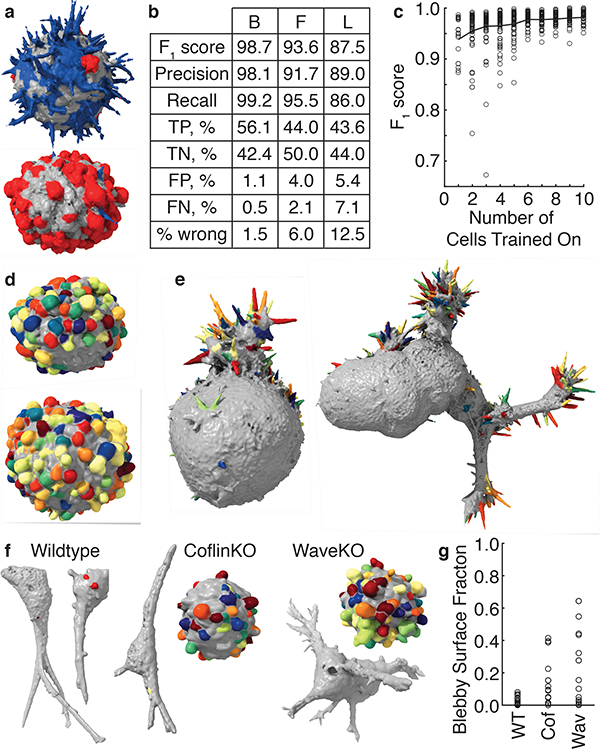
Figure 4. Validation and robustness of morphological motif detection.
(a) A multiclass detector applied to cells derived from a human melanoma xenograft cultured in mice (representative of 9 cells). Filopodia are shown blue, blebs are shown red, and areas with neither filopodia nor blebs are shown gray. (b) Validation measures for a bleb detector (left) trained on 19 MV3 melanoma cells, a filopodia detector (center) trained on 13 HBEC cells, and a lamellipodia detector (right) trained on 13 dendritic cells. TP, TN, FP, and FN are abbreviations for true positive, true negative, false positive, and false negative respectively. (c) The F1 score as a function of the number of cells trained on. The red line indicates the mean F1 score averaged over a maximum of 100 sets of cells, whereas the gray dots show individual sets of cells. (d) A bleb detector trained on the MV3 melanoma cell line applied to cells derived from a human melanoma xenograft cultured in mice (representative of 24 cells). (e) A filopodia detector trained on xenograft-derived melanoma cells applied to HBEC cells (representative of 13 cells). A filopodia detector trained on HBECs applied to the cell on the left is shown in Supplementary Fig. 5 and applied to the cell on the right is shown in Fig. 3. (f) Blebs detected on wildtype, cofilin-1 knock out, and Wave2 knockout U2OS cells in 3D collagen. (g) For these three cell types, the percentage of the surface that is blebby. We analyzed 19 wildtype, 15 cofilin-1 knockout, and 14 Wave2 knockout cells.

