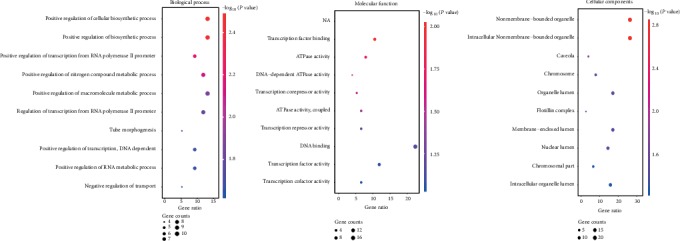
Figure 3.

Functional and pathway enrichment analyses of the overlapping DEGs in PC. (a) BP, (b) MF, (c) CC, and (d) KEGG pathway analyses. The x-axis represents the q value (-log10), and the y-axis represents the GO term. The GO terms were measured by the rich factor, Q value, and number of genes enriched. The greater the rich factor is, the greater the degree of enrichment and the greater the P value (0, 1). The brighter the color of red is, the more significant the term.
