Figure 6.

(a) Expression of the TUBB gene between all tumor samples and normal tissue (bar plot). (b) Differential expression of TUBB between PC and normal tissue in body map and (c) on box plots (N: normal; T: tumor).

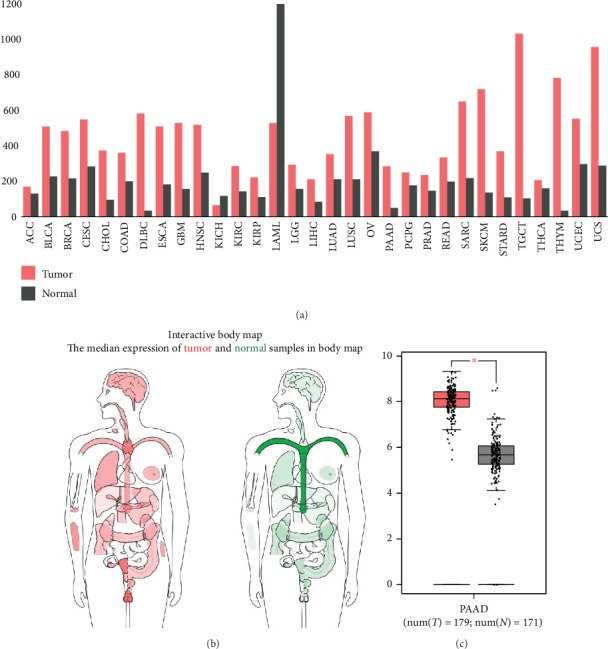
(a) Expression of the TUBB gene between all tumor samples and normal tissue (bar plot). (b) Differential expression of TUBB between PC and normal tissue in body map and (c) on box plots (N: normal; T: tumor).