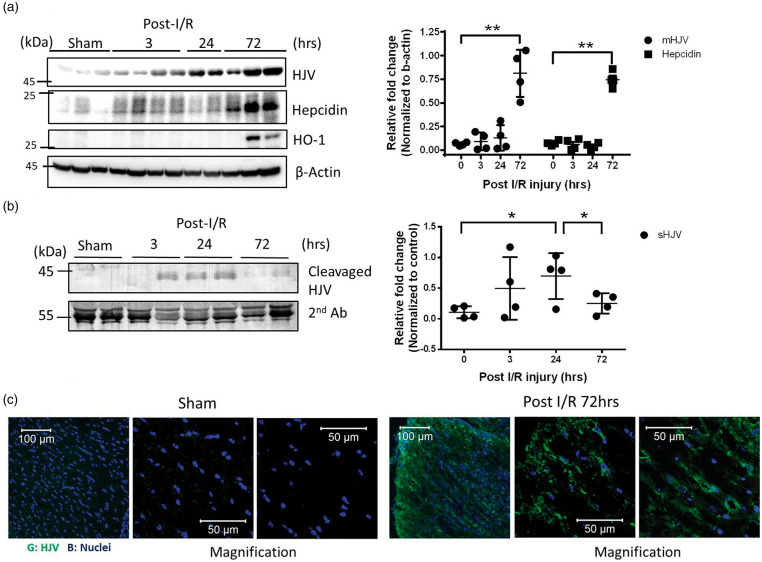
Figure 2.
Time-course of HJV/Hepcidin axis in mice after receiving middle cerebral artery occlusion. (a) Brains of stroke mice were dissected at 3, 24, 72 h after MCAO surgery and compared with sham group. Representative Western immunoblots for HJV, Hepcidin, and HO-1 in mice brain at indicated time point. Quantification of immunoblot band intensity of brain lysates for each time point. Intensities of bands were normalized by β-actin, which was used as loading controls. n = 7 in sham, post-I/R 3, or 72 h group. n = 6 in post-I/R 24 h group. (b) Bloods from stroke mice after immunoprecipitation with HJV antibody were analyzed by immunoblotting. Intensities of bands were normalized by anti-mice serum, which was used as loading control. Molecular size markers are indicated at the left in kDa. Data were expressed as mean±SD; *, P < 0.05; **, P < 0.01 versus sham group. (c) Immunofluorescence staining of HJV in mice brain sections revealed significantly increased HJV expression in Mice brains from C57BL/6 mice suffered 1 h MCAO surgery and 72 h reperfusion (n = 2 in each group).

