Figure 3.
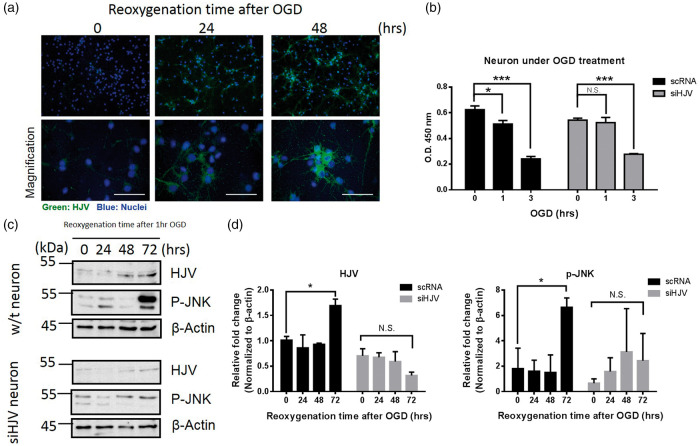
HJV was increased in mice neuron cells under OGD condition. (a) Mice neuron cells under OGD for different time points. Cells were fixed and stained with anti-HJV (green) and DPAI (blue). Scale bars: 50 μm. (b) Cell viability of mice neuron cells was performed by CCK-8 method. Cells transfected with scRNA or siHJV to knockdown the expression of HJV under OGD treatment at a designated time point. (c) Representative Western immunoblots for HJV and phosphorylated JNK from mice neuron cells under reoxygenation condition at indicated time point after OGD treatment. (d) Intensities of bands were normalized by β-actin, which was used as loading control. Molecular size markers were indicated at the left in kDa. Data were expressed as mean ± SD, n = 3. *P < 0.05; ***, P < 0.001; N.S., no significant versus control group.

