Figure 1.
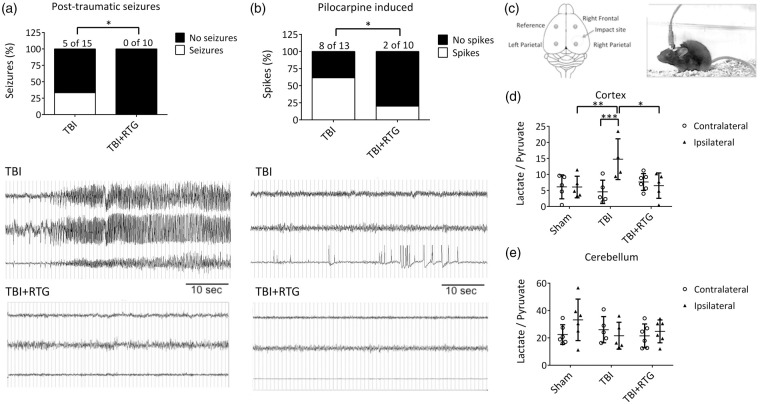
M-current augmentation prevented TBI-induced seizures, abnormal cortical activity, and metabolic stress. (a) Top, bars summarize the percentage of animals that displayed spontaneous seizures in the TBI and TBI + RTG groups. The number of animals that displayed seizures in each group and the total number of animals per group are indicated above each bar (TBI n = 6♀ 9♂; TBI + RTG n = 5♀ 5♂). Bottom, examples of EEG recordings of a seizure, in an animal in the TBI cohort, and a phenotypically-normal EEG recording, in a mouse in the TBI + RTG cohort. (b) Top, bars summarize the percentage of animals that displayed epileptiform spike activity after pilocarpine challenge at a dose that is considered subthreshold in naïve mice (TBI n = 6♀ 7♂; TBI + RTG n = 5♀ 5♂). Whereas 61% of mice in the TBI group displayed abnormal spike activity, this was observed in only 20% of the mice in the TBI + RTG cohort. Bottom, EEG recordings of epileptiform spike activity recorded from a TBI animal and unremarkable cortical activity recorded from a TBI + RTG animal monitored for 24 h immediately after pilocarpine challenge. (c) Left, shown schematically is the placement of the epidural screw electrodes used for EEG recording. Right, shown is an image of a mouse fastened with an electrode head mount and preamplifier. (d, e) Bars summarize the lactate/pyruvate ratio in cortical and cerebellar samples from the Sham (n = 3♀ 3♂), TBI (n = 2♀ 3♂), and TBI + RTG (n = 3♀ 3♂) cohorts. Data are displayed as mean and S.D., *p < 0.05, **p < 0.01, ***p < 0.001.

