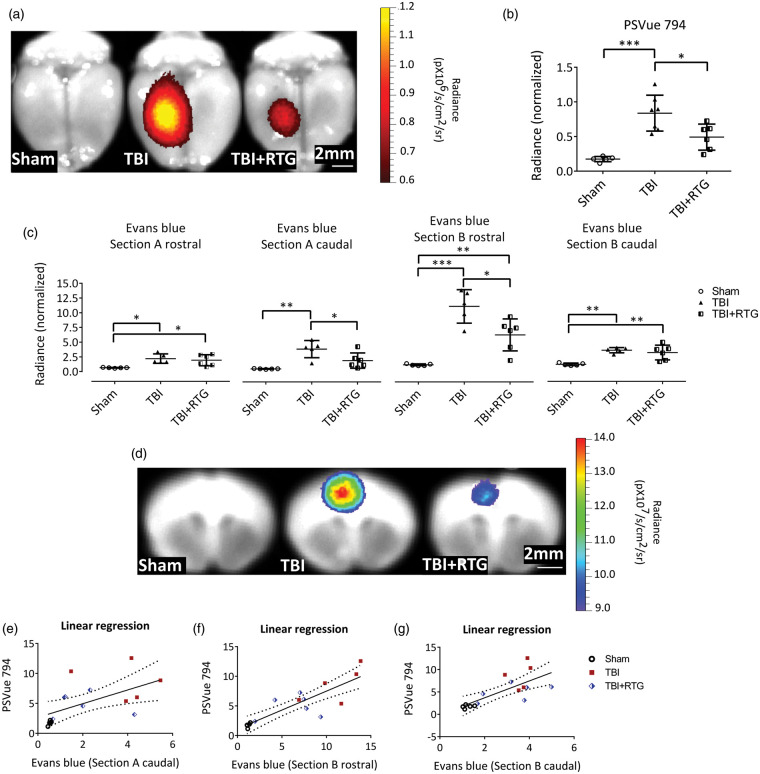
Figure 2.
M-current augmentation prevented TBI-induced cell death and the focal increase in BBB permeability. (a) Representative ex vivo images of near-infrared fluorescent dye PSVue 794 probed brains. PSVue 794 was used to monitor cell death. The probe was localized to the peri-injured area. Radiant efficiency was illustrated by a pseudocolor scale ranging from black (least intense) to red (most intense) and quantified in Panel (b). Cell death was observed three days after CCCI, which was significantly reduced by RTG treatment (Sham n = 5♂; TBI n = 7♂; TBI + RTG n = 6♂). Evans blue dye was used to monitor BBB disruption. Panel (c) show Evans blue signal quantification for both rostral and caudal faces of two consequent sections (Sections A and B) around Bregma. The four sections correspond to two sides (rostral and caudal) of Sections A and B. “Section A rostral” is the most rostral and “Section B caudal” is the most caudal. Panel (d) shows representative ex vivo images of the most prominent BBB disrupted area, the epicenter of the hit (Section B-rostral). Although Evans Blue signal was more intense in the cortex, especially around the epicenter of the injury, subcortical regions like Hippocampus and Striatum also showed signs of BBB breakdown. However, since the intensity of the signal in the cortex was much higher them in other regions, the scale used for these images makes it hard to visualize the Evans Blue signal in the subcortical regions. Radiant efficiency was illustrated by a multicolor scale ranging from blue (least intense) to red (most intense) and quantified. BBB disruption was observed three days after CCCI, which was significantly reduced by RTG treatment (Sham n = 5♂; TBI n = 7♂; TBI + RTG n = 5♂). Panels (e–g) show linear regression analysis showing that BBB disruption is related to levels of cell death. Data are displayed as mean and S.D., *p < 0.05, **p < 0.01, ***p < 0.001.

