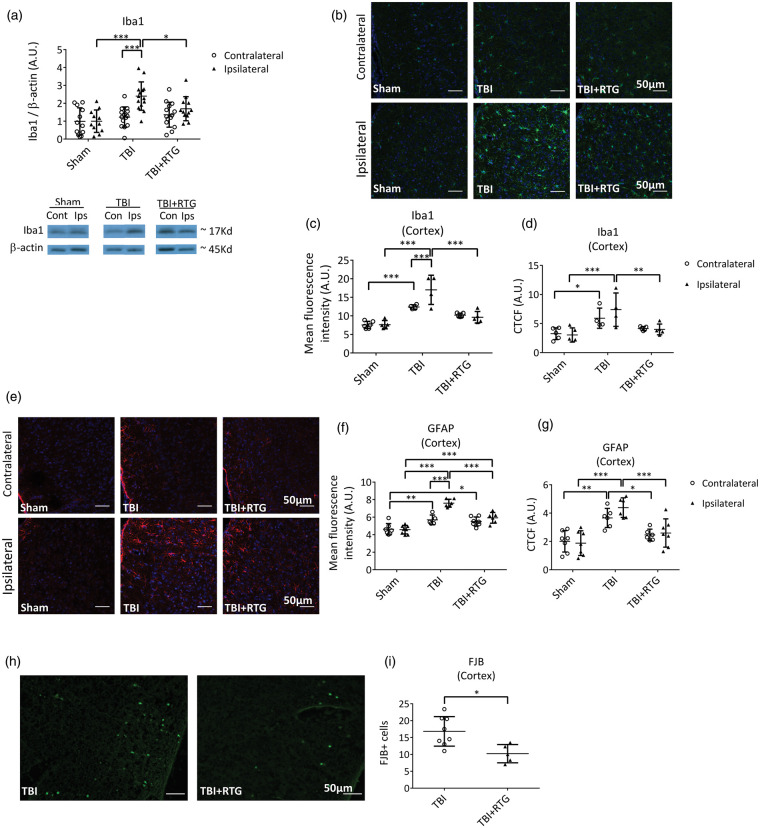
Figure 3.
M-current augmentation suppressed TBI-induced microglial activation in the ipsilateral cortex. (a) Top, bars summarize semi-quantification of immunoblots of Iba1 in ipsilateral and contralateral hemispheres from the Sham (n = 7♀ 5♂), TBI (n = 8♀ 6♂), and TBI + RTG (n = 8♀ 8♂) cohorts. β-actin was used as internal control and protein levels were normalized to the Sham ipsilateral average. Similar results were obtained using Ponceau red staining as an internal control (Supplementary Figure 4). Bottom, shown are representative exemplary immunoblot bands for each hemisphere from each mouse group. The full image obtained with the film exposure to the membrane can be found in Supplementary Figure 5. Immunostaining images of TBI-induced Iba1 increase and RTG action are exemplified in panel (b) (20×). Images are fluorescence emission of antibodies against Iba1 (green) and the nuclear marker DAPI (blue) of brain slices from Sham (n = 6♂), TBI (n = 4♂), and TBI + RTG (n = 5♂) animals. Mean fluorescence intensity per image of Iba1 staining was quantified in cortical slices (c). A significant increase in microglial/macrophage reactivation was observed after TBI, which was prevented by RTG treatment. Iba1 increase could also be observed in the contralateral hemisphere. Additionally, quantification of the corrected total cell fluorescence (CTCF = Integrated Density – (Area of selected cell × Mean fluorescence of background readings)) revealed an increase in Iba1 expression in TBI mice (d). Panel (e) shows representative exemplary images of immunohistochemical fluorescent staining of GFAP (red) and DAPI (blue), for the two hemispheres of Sham (n = 8♂), TBI (n = 6♂), and TBI + RTG (n = 7♂) animals. TBI induced a significant increase in astrogliosis that was attenuated by M-current augmentation (f–g). Finally, CCCI induced cell-death was visualized and quantified by Fluro Jade B (FJB) staining (H). Cortical slices of TBI + RTG animals (n = 5♂) had lower cell-death stanning than slices from TBI animals (n = 8♂) (I). Data are presented as the mean and S.D., *p < 0.05, **p < 0.01, ***p < 0.001.

