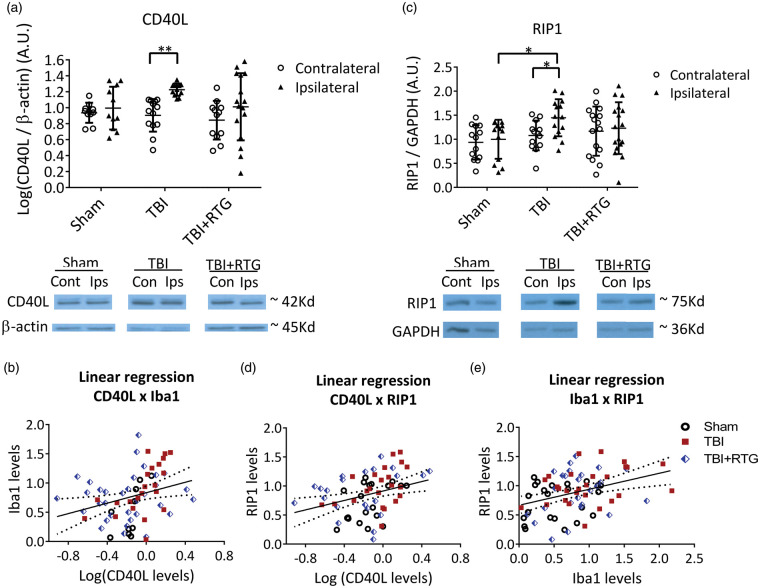
Figure 4.
M-current augmentation blocked the TBI-induced inflammatory/immunological response and the TBI-induced increase in the expression of a cell death-related protein at six days post-TBI. (a) Top, bars summarize the semi-quantification of CD40L levels in ipsilateral and contralateral hemispheres from mice of the Sham (n = 7♀ 5♂), TBI (n = 8♀ 6♂), and TBI + RTG (n = 8♀ 6♂) cohorts. CD40L levels were normalized by β-actin levels in each sample independently. Bellow, shown are exemplary bands of CD40L and β-actin immunoblots. (b) Analysis of the correlation between levels of CD40L and Iba1 plotted as scatterplots. The derived data were fit by a direct linear regression model, as shown by the line, which indicates a high correlation. (c) Top, bars summarize immunoblotting semi-quantification of RIP1 levels in Sham (n = 8♀ 5♂), TBI (n = 8♀ 6♂), and TBI + RTG (n = 9♀ 8♂) cohorts. RIP1 levels in each sample were normalized by GAPDH levels. Group means were normalized by the mean of levels from the sham ipsilateral samples. Similar results were obtained by normalizing CD40L or RIP1 to Ponceau staining (Supplementary Figure 4). Full immunoblotting images can be seen in Supplementary Figure 5. (d), (e) Plotted are the correlations between RIP1 and CD40L levels, or between Iba1 and Rip1 levels, both of which were seen to be significantly correlated by fits to a linear regression model. Data are plotted as the mean and S.D., *p < 0.05, **p < 0.01.

