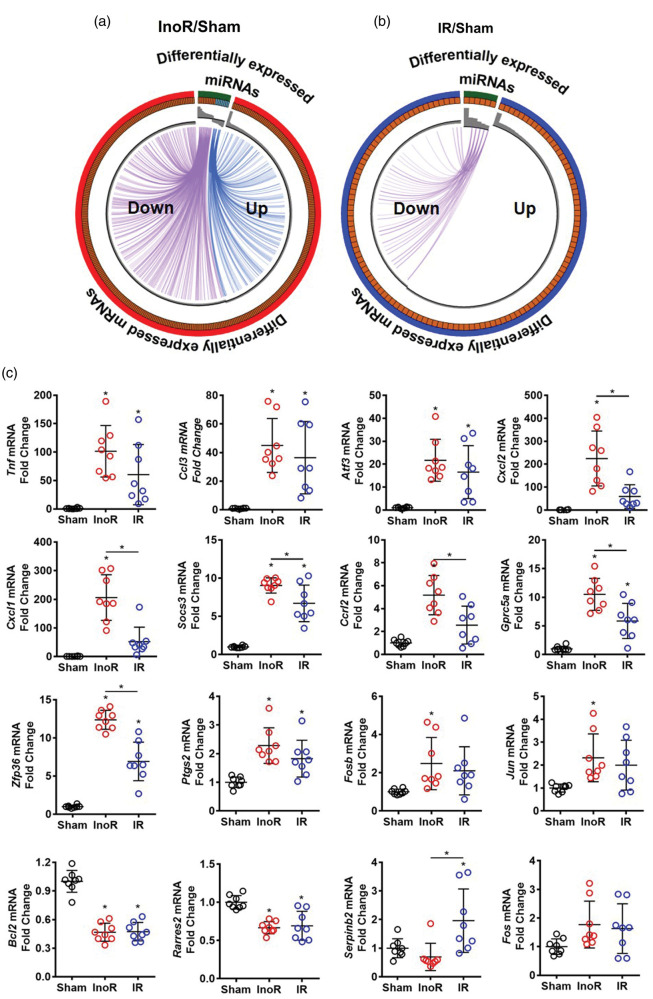
Figure 4.
miRNA regulatory modules are significantly altered in ischemic stroke. (a, b) Circos plots linking significantly altered miRNAs and their predicted inversely altered mRNA targets. Purple, miRNAs increased and mRNA decreased. Blue, miRNAs decreased and mRNAs increased. Expression signal (fold change) represented by gray bars in inner Circos ring. InoR: Ischemia no Reperfusion; IR: ischemia-reperfusion; and Sham control. (a) InoR/Sham (n = 5). (B) IR/Sham (n = 5). (C) Validation of candidate gene (mRNA) expression by real-time PCR for Tnf, Ccl3, Atf3, Cxcl2, Cxcl1 Socs3, Ccrl2, Gprc5a, Zfp36, Ptgs2, Fosb, Jun, Bcl2, Rarres2, Serpinb2, and Fos (n = 8). One-way ANOVA with Tukey’s multiple comparisons test. Data are presented as mean ± SD (*p < 0.05). Groups indicated by * without accompanied bar linking two groups indicates that the group with the * was compared to the sham control group.

