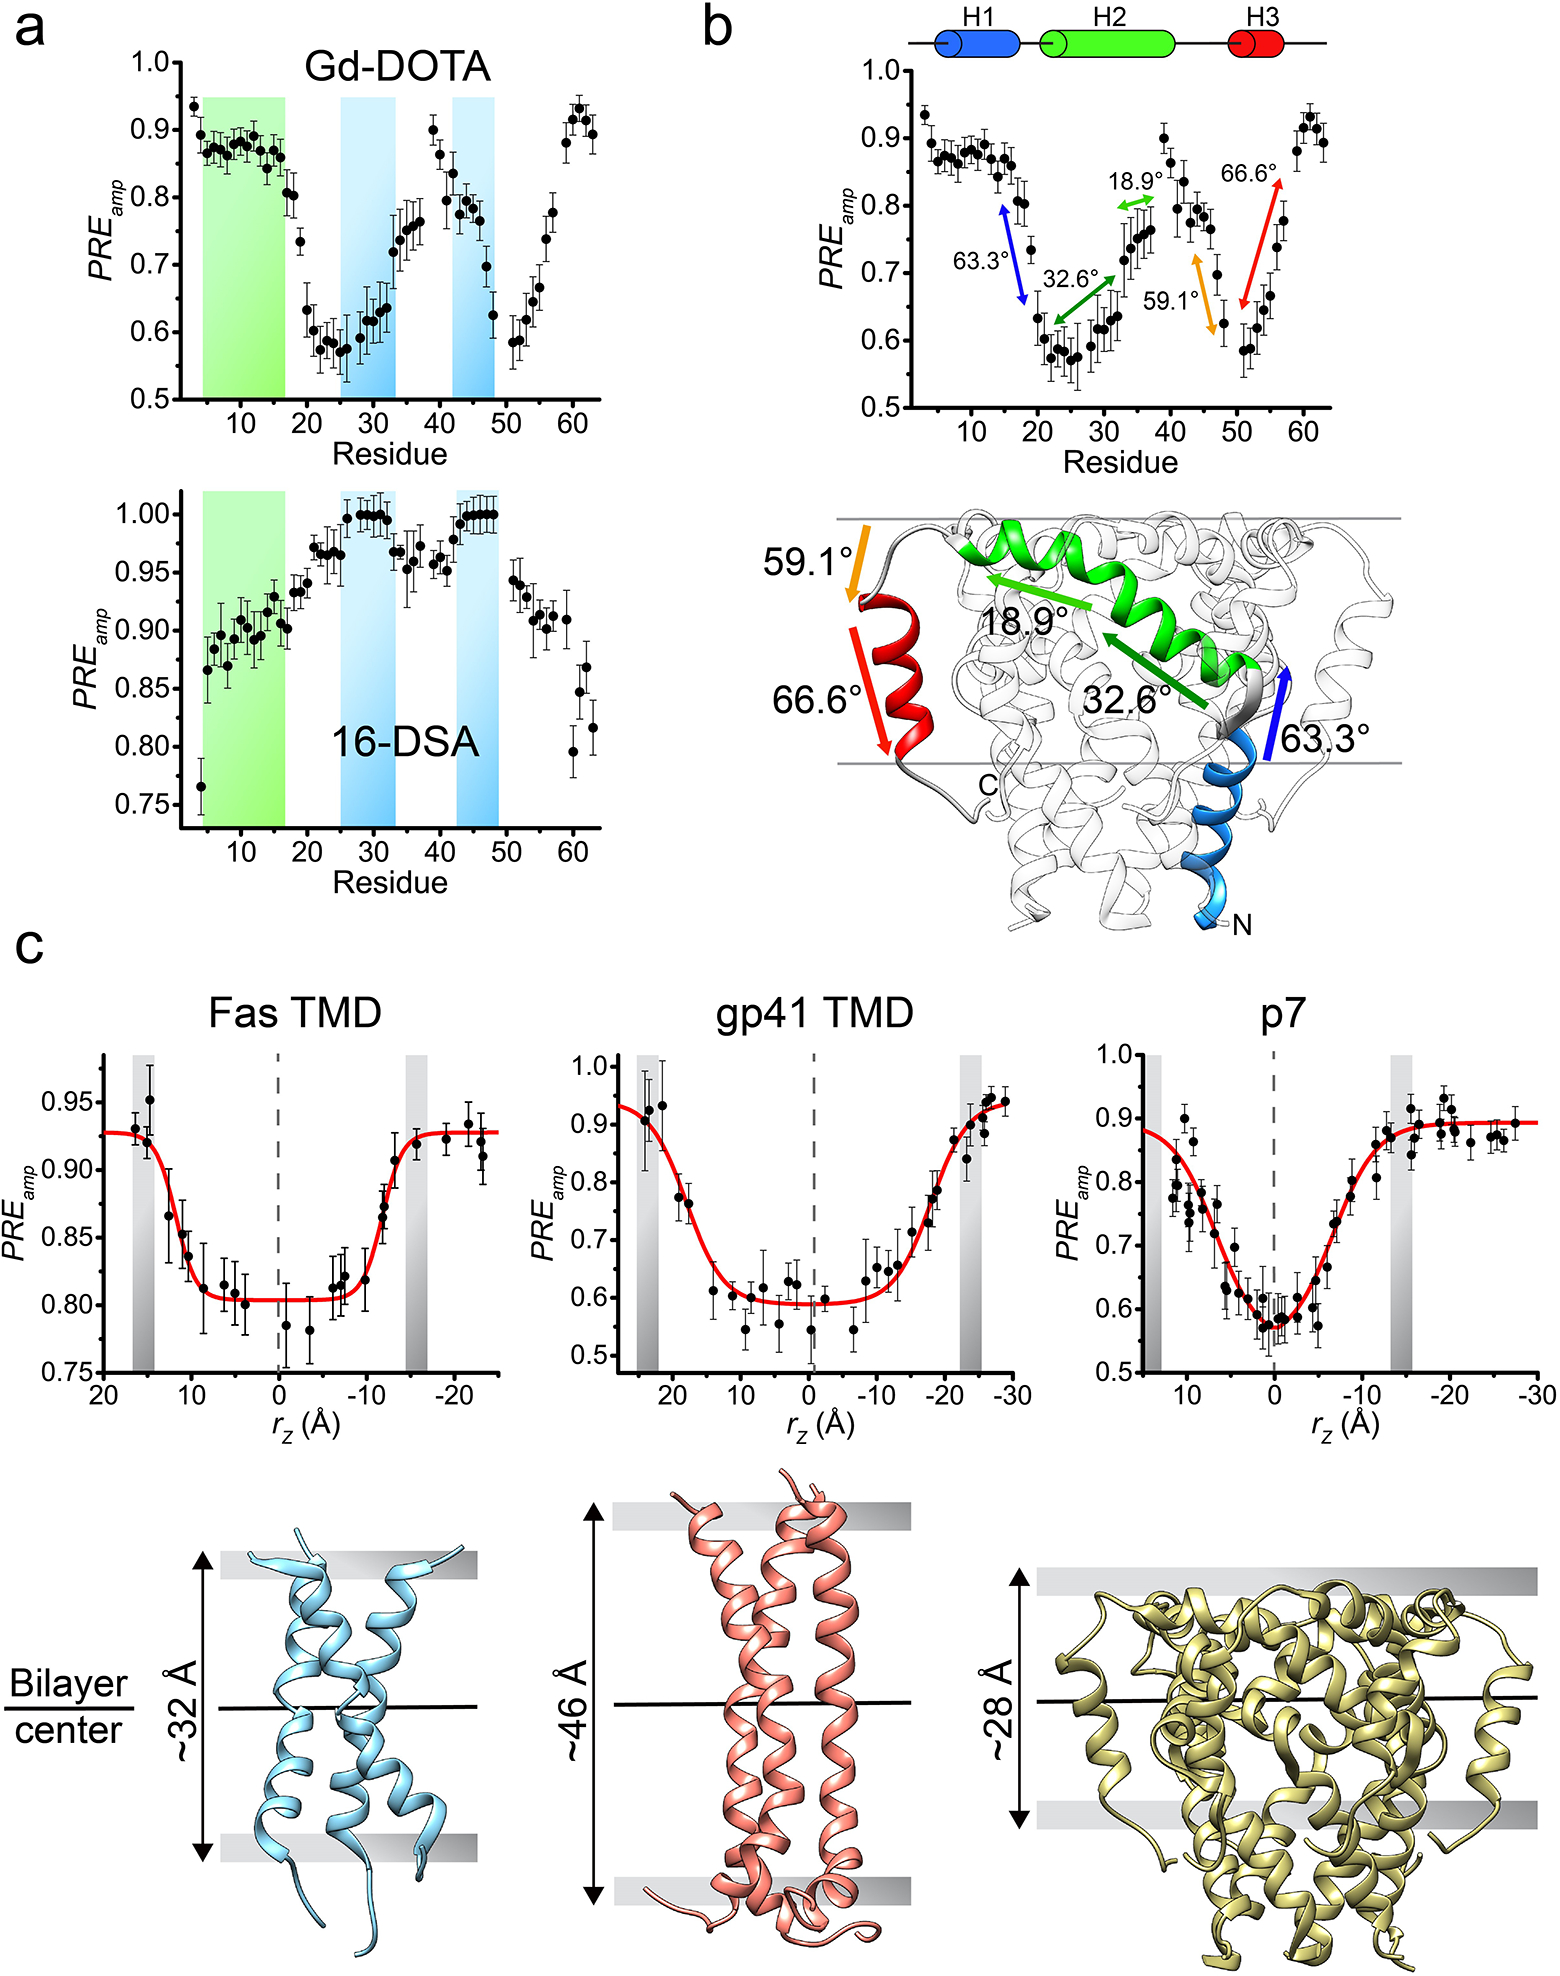
Figure 6. Analysis of transmembrane partition.

(a) Comparison between residue-specific PREamp derived from titrating Gd-DOTA (top) and 16-DSA (bottom), shown for the HCV p7 in bicelles with q = 0.6. The two plots are reciprocal and their analysis (as in Box 5) yielded identical membrane partition. As can be seen, Gd-DOTA is better suited for investigating residues well-buried in the bicelle (shaded in blue), showing steeper slope in the Gd-DOTA plot, whereas 16-DSA is more senstive at probing residues in the bicelle head-group region (shaded in green). (b) The PREamp plot from Gd-DOTA titration in (a) for showing correlation with the p7 structure. The arrows (in different colors) indicate the fragments of the p7 structure (bottom) for which the slope of PREamp correlates well with the steepness of the fragment in the hexamer structure. The steepness is reported as the angle of the fragment relative to the bilayer plane. (c) Membrane partition calibration curves obtained for the Fas-TMD (left), HIV-1 gp41 TMD (middle) and HCV p7 (right), describing the position of the proteins in the bicelle. The gray bars represent the bicelle boundaries, identified as the position at which the PREamp begin reaching saturation. At the bottom, the membrane partitions of the three proteins show different lipid bilayer thickness around the proteins (32, 46 and 28 Å for Fas-TMD, HIV-1 gp41 TMD and HCV p7, respectively).
