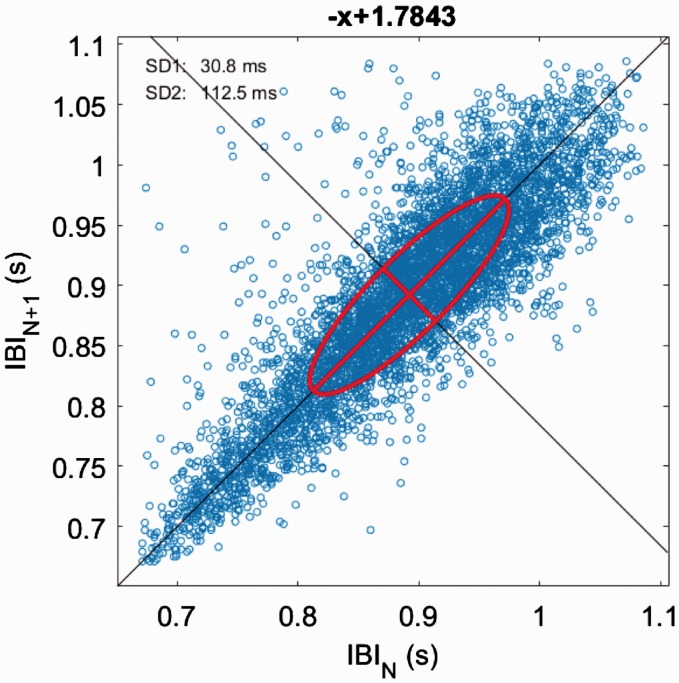
Figure 3.
Poincare plot of healthy individual taken from 5-min ECG recording and analysed in Kubios V3.1. A Poincare plot is a non-linear heart rate variability technique that plots each RR interval as a function of the previous RR interval. The plot provides summary information such as total variability represented as a central ellipse. The plot is analysed by calculating the standard deviations SD1 relating to fast beat-to-beat variability and SD2 describing longer term variability.

