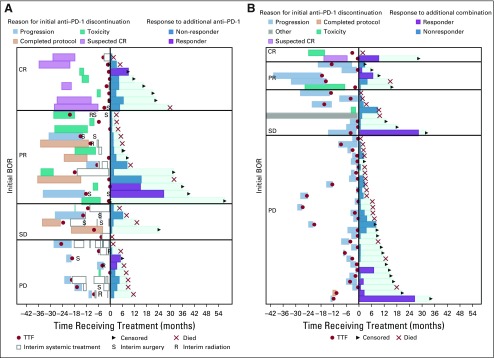
FIG 3.
Event-history plot showing outcomes of patients who were retreated with (A) single-agent anti–programmed death-1 (anti–PD-1) therapy or (B) combination anti–PD-1 with anti-CTLA4. Time zero is the start of retreatment. Patients are grouped on the basis of the best overall response to initial anti–PD-1 therapy (complete response [CR], partial response [PR], stable disease [SD], progressive disease [PD]), which is noted on the left side of the panel. The duration of the first course of anti–PD-1 is indicated by light blue, progression of disease; and the reason for discontinuation is indicated by the color (red, suspected CR; teal, toxicity; orange, the course of planned therapy; purple, toxicity; yellow, progression of disease). Red dots indicate time of progression of disease. Open bars indicate nonimmunotherapy systemic treatments. In addition, some patients received radiation therapy (R) or surgery (S). After time zero, colored bars indicate the duration of retreatment. Purple bars show patients who responded; dark blue bars are patients whose best response to retreatment was disease progression. The aqua bars indicate the duration of survival. Patients have either died (red X) or were censored (arrowhead). BOR, best overall response; TFF, time to treatment failure.

