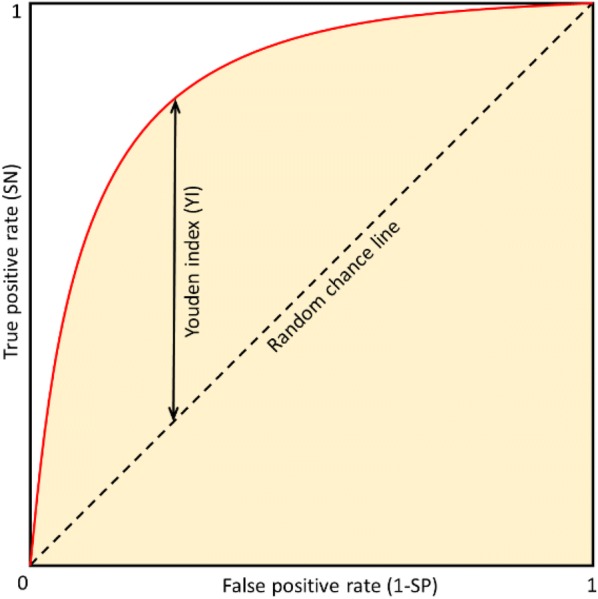
Fig. 2.

ROC curve and Youden index. The ROC curve (red line) is the dependency of true positive rate (it equals to SN) on false positive rate (it equals to 1-SP) at various thresholds. The random chance line represents a classifier that assigns examples into individual classes randomly. Orange shaded area represents the area under the ROC curve (AUC). The larger the AUC, the better is the overall performance of the classifier. Youden index (YI) is the point on the ROC curve that is farthest from the random chance line along the SN axis
