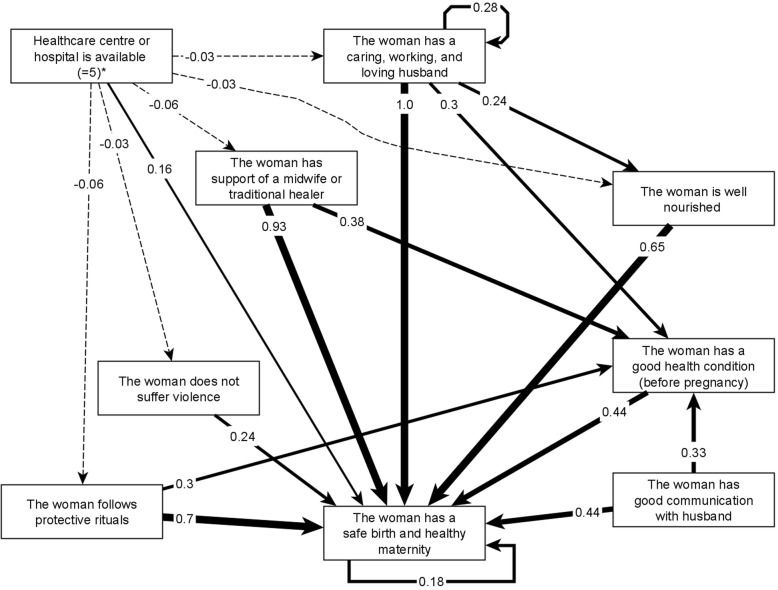
Fig. 2.
Fuzzy cognitive map of the most influential categories of protective factors on maternal health. To simplify the graph, we only included the highest-weighted relationships. Additional file 2 contains all the relationships on the map. Strong lines represent excitatory relationships and dashed lines represent inhibitory relationships. The numbers on the edges represent the cumulative net influence of one category on another, where 1 is the highest influence in the map. For this map we used the maximum positive influence reported by participants for the role of hospitals and health centers

