
Fig. 1. The αvβ8 integrin ectodomain bound to L-TGF-β1.
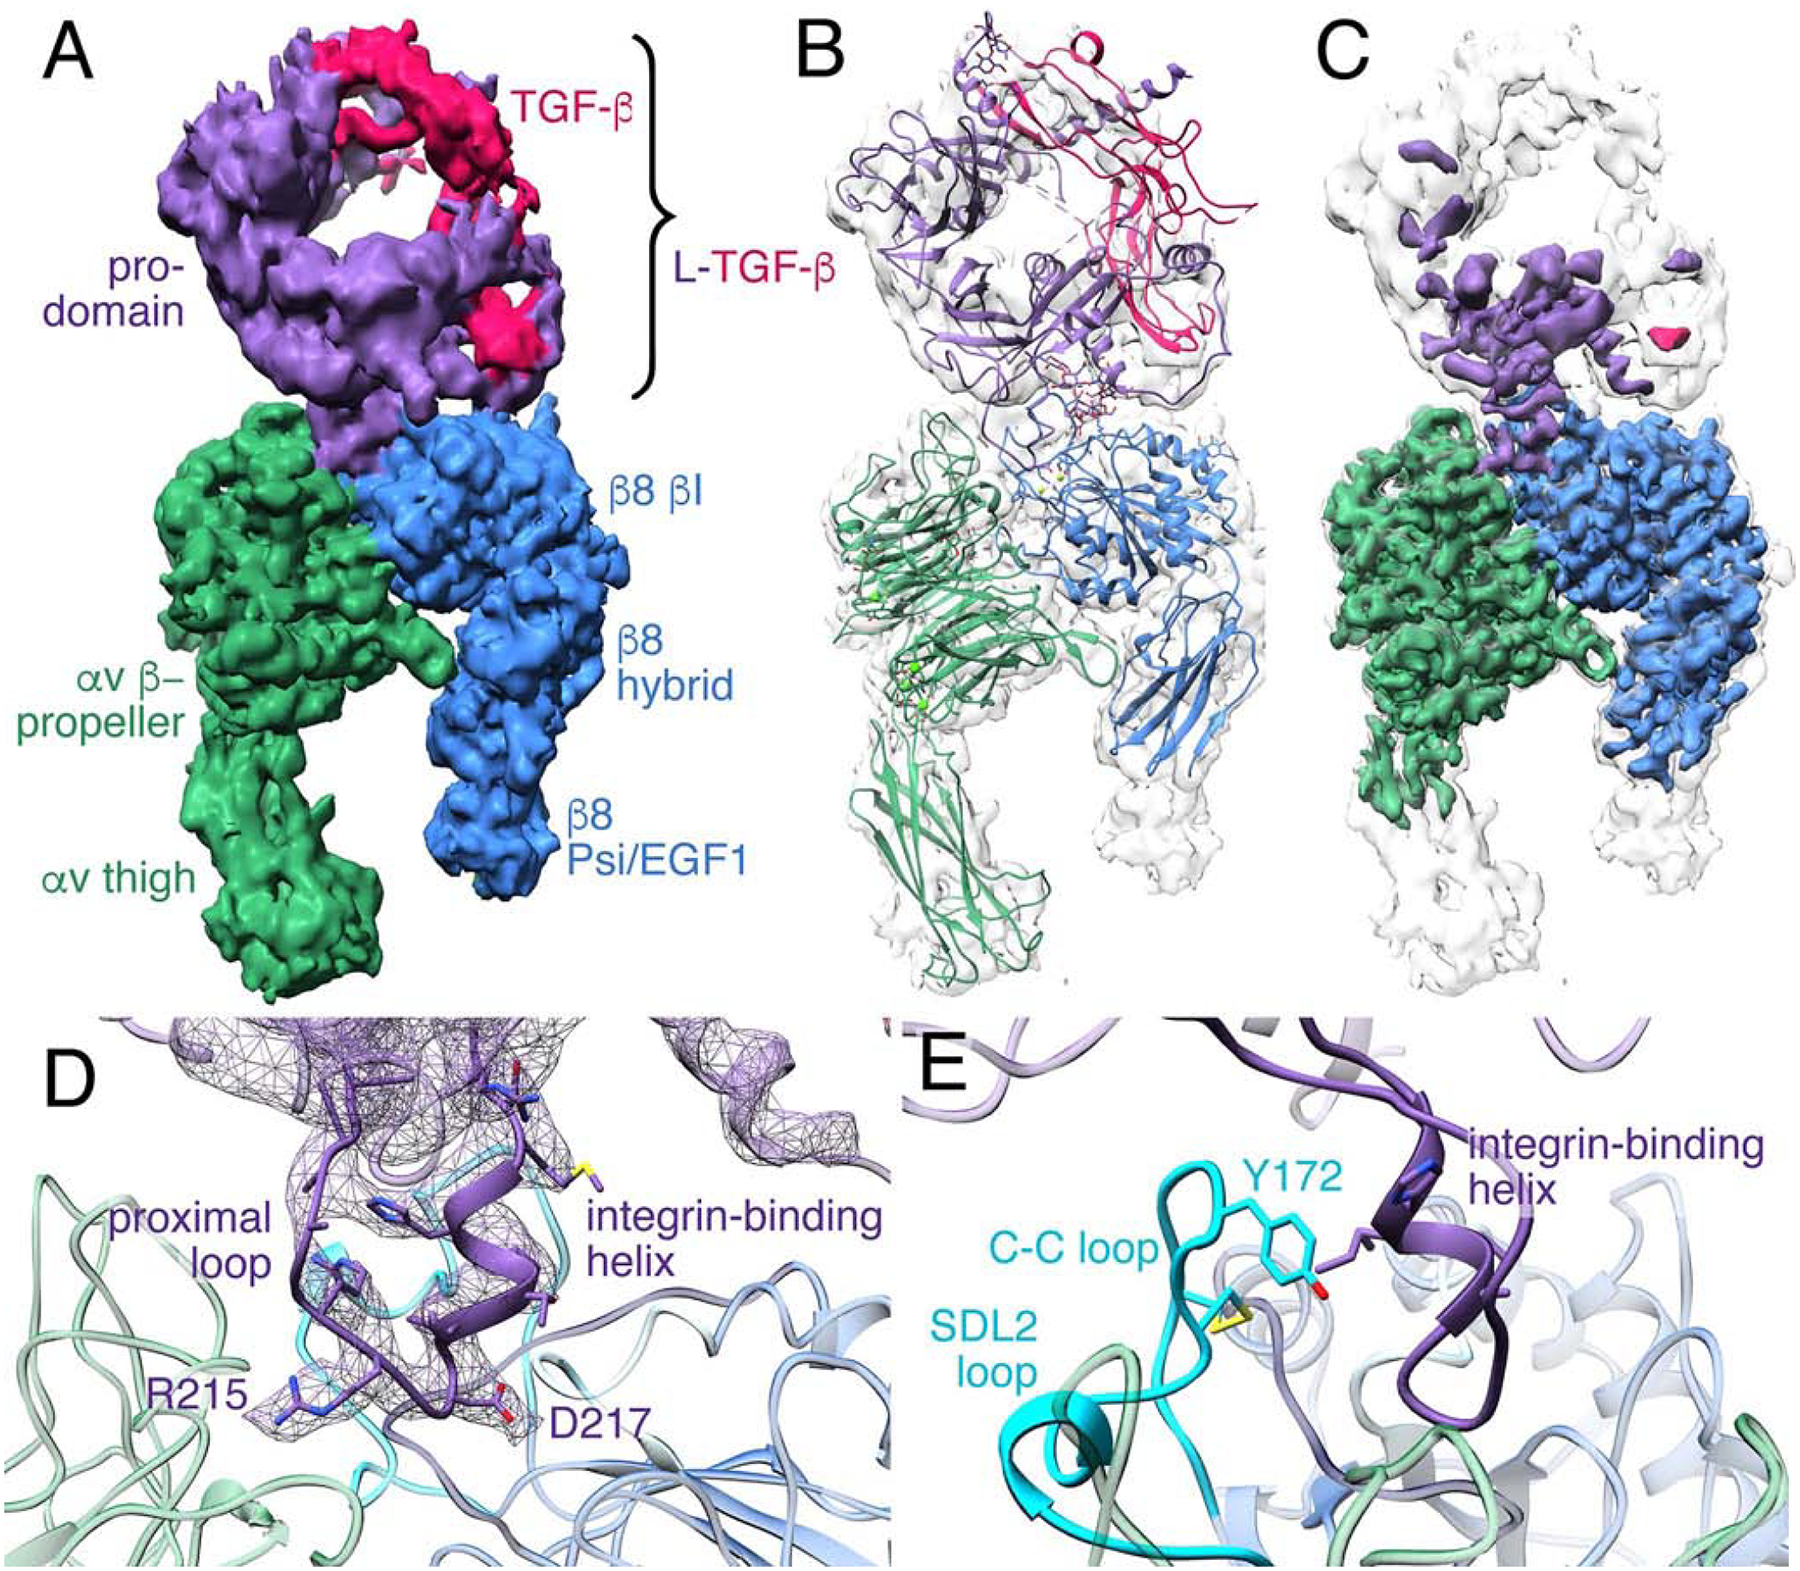
(A) Cryo-EM density map of αvβ8 integrin ectodomain with L-TGF-β1 bound. The map is displayed as unsharpened and at a low-threshold. The color code is as follows: integrin αv-subunit is green, integrin β8-subunit is blue, prodomain of L-TGF-β1 is purple, and mature TGF-β1 is red. (B) Ribbon diagram of αvβ8/L-TGF-β1 displayed within the density map shown in (A). (C) The sharpened cryo-EM map is shown in color, superimposed with the unsharpened map in semi-transparent white. (D) A ribbon diagram shows a close-up view of the binding interface between αvβ8 and L-TGF-β1. The EM density of the integrin-binding motif of L-TGF-β1, including proximal loop, RGD motif, and integrin-binding helix is shown in purple mesh. (E) Ribbon diagram showing the C-C loop within the SDL2 loop of the β8 subunit (cyan) relative to the L-TGF-β1 integrin-binding helix. Related information is in Fig. S1, S3.