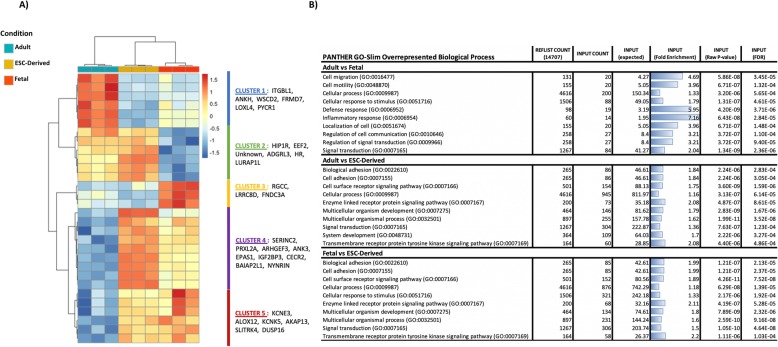
Fig. 2.
Heatmap of top DE genes and GO terms comparing adult, fetal and ESC-tenocytes. a Differential gene expression analysis for top 30 genes DE in adult and fetal tenocytes. Dendrograms are based on Pearson’s correlation, with red and blue colours representing up- and downregulated genes, respectively. Samples with intermediate expression are represented in yellow. Groups are visualised in columns, with the coloured bar above the heatmap indicating the grouping variable. Genes are represented in individual rows, with patterns of up- and downregulated genes being classified into 5 clusters. b Summary of the top 10 significantly enriched gene ontology (GO) biological process terms for each pairwise comparison of DE genes in adult, fetal and ESC-derived tenocytes. Go terms are arranged alphabetically to allow easier comparison between each group

