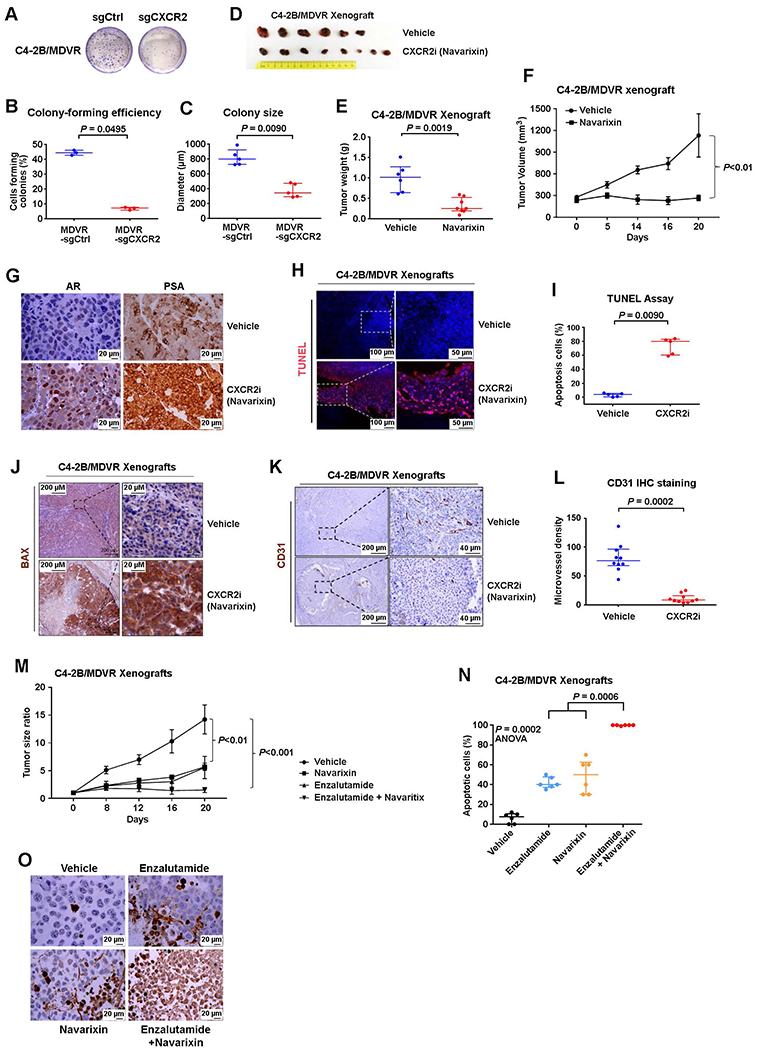
Fig. 5. Advanced and therapy-resistant PCa is sensitive to CXCR2 inhibition.

(A to C) Tumorigenesis of C4-2B/MDVR cells with/without CRISPR-Cas9 knockout of CXCR2. Representative images (A), quantification of colony-forming efficiency (B), and colony size (C) of C4-2B/MDVR cells with/without the CXCR2 gene deleted. Cells were cultured for 2 weeks. (D to F) Effect of navarixin on enzalutamide-resistant PCa C4-2B/MDVR cells’growth in vivo. Images (D), weights (E), and volumes (F) of C4-2B/MDVR tumors in mice treated with navarixin (70 mg/kg) or vehicle control. (G) Representative images of IHC staining for AR and prostate-specific antigen in control and navarixin-treated C4-2B/MDVR xenografts. (H to J) Representative images (H) and quantification (I) of immunostaining for terminal deoxynucleotidyl transferase-mediated deoxyuridine triphosphate nick end labeling (TUNEL) in tumors from mice treated with vehicle or CXCR2 inhibitor navarixin for 3 weeks. Representative images (J) of BCL2 associated X, apoptosis regulator (BAX) immunostaining of xenograft tumors in mice treated with/without navarixin for 3 weeks. (K and L) Representative images (K) and quantification (L) of blood vessel marker CD31 in mice treated with vehicle or navarixin (70 mg/kg) for 3 weeks. (M) Quantification of C4-2B tumor burden in mice treated with vehicle, enzalutamide, navarixin, or both enzalutamide and navarixin. (N and O) Quantification (N) and representative images (O) of immunostaining for TUNEL in mice treated with vehicle, enzalutamide, navarixin, or both enzalutamide and navarixin. ANOVA, analysis of variance. Logistic regression analysis was performed using nonparametric Mann-Whitney U test; lines represent median and interquartile range.
