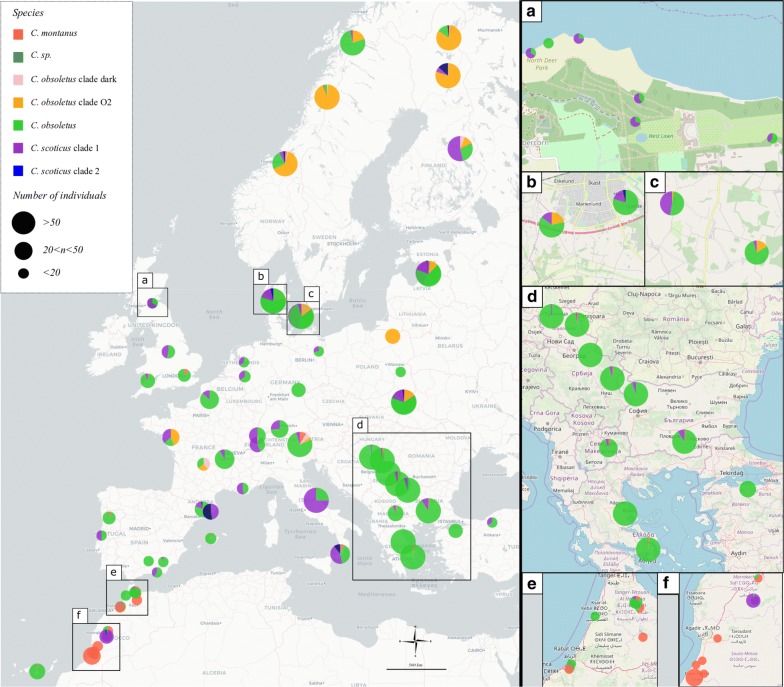
Fig. 1.
Map of biting midges sampling sites represented by the number of individuals per clade within the Obsoletus/Scoticus Complex. The different clades identified are shown in different colours. The size of circles on Europe map correspond to the number of individuals per clade within the cryptic species. The numbered maps on the right correspond to magnifications of some study areas. The sites of sampling too close and thus the pie charts this superimposed are to be taken into account in the numbered magnifications and not on the main map. Magnifications: a Scotland sample sites; b, c Denmark sample sites; d Balkans sample sites; e, f Morroco sample sites

