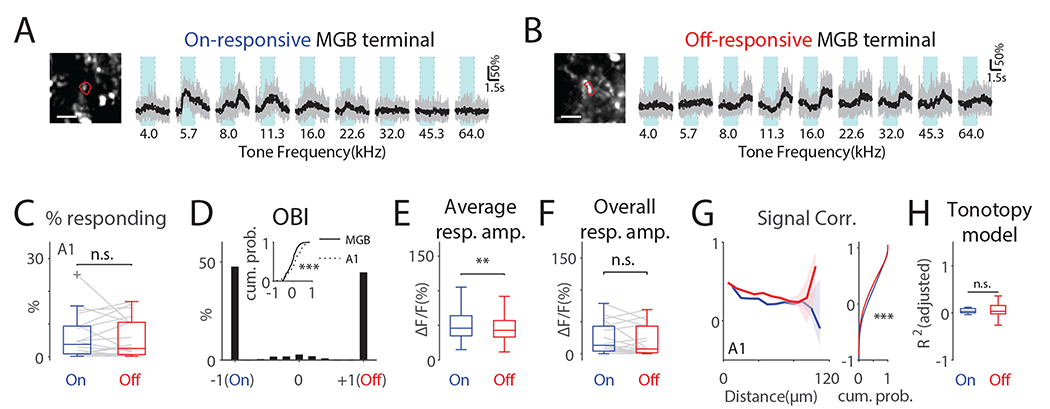
Fig. 6. MGB terminals in A1 largely show either On-R or Off-R and Off-R terminals show higher local signal correlations.
(A) On-responsive terminal. The image shows the contour of the terminal in red. Scalebar: 5μm. Light blue areas indicate tone duration. (B) Same as in (A) but shows an off-responsive terminal. (C) Proportion of on- or off-responding terminals is similar. On: 5.99% ± 6.72%; Off: 5.62% ± 6.00%; paired t-test, t(20)=0.34, p=0.74. (D) Histogram of OBI values of MGB terminals in A1. Inset shows CDFs of OBI values other than −1 and 1 from MGB terminals and A1 L2/3 neurons (Wilcoxon rank sum test, z=3.64, p=2.71×10⁻⁴). (E) Individual MGB terminals in A1 show significant larger On-Rs (Wilcoxon rank sum test, z=2.91, p=0.0036). (F) Overall On/Off-R amplitude (see Method, Wilcoxon rank sum test, z=0.85, p=0.39). (G) Off-Rs show higher off-SC over distance (0–70μm). Dashed lines show 95% confidence interval around the median. Right panel shows cumulative distribution function of all On- and Off-SC. ‘***’ indicate p<0.001. (H) Goodness of fit of linear On-R and Off-R tonotopy model in MGB terminals in A1 was similar.

